how to use a color scheme with the “plot function” ?
DataGraph Forums › Technical Support › Support Desk › how to use a color scheme with the “plot function” ?
- This topic has 4 replies, 2 voices, and was last updated 1 year, 9 months ago by
nautile.
-
AuthorPosts
-
February 18, 2025 at 10:54 am #15518
nautile
ParticipantHello ! I’m setting up some classroom demos of different population dynamics functions using the function plotting tool and I can’t seem to find the trick for how to use a color scheme global variable to control the line color – is this possible ?
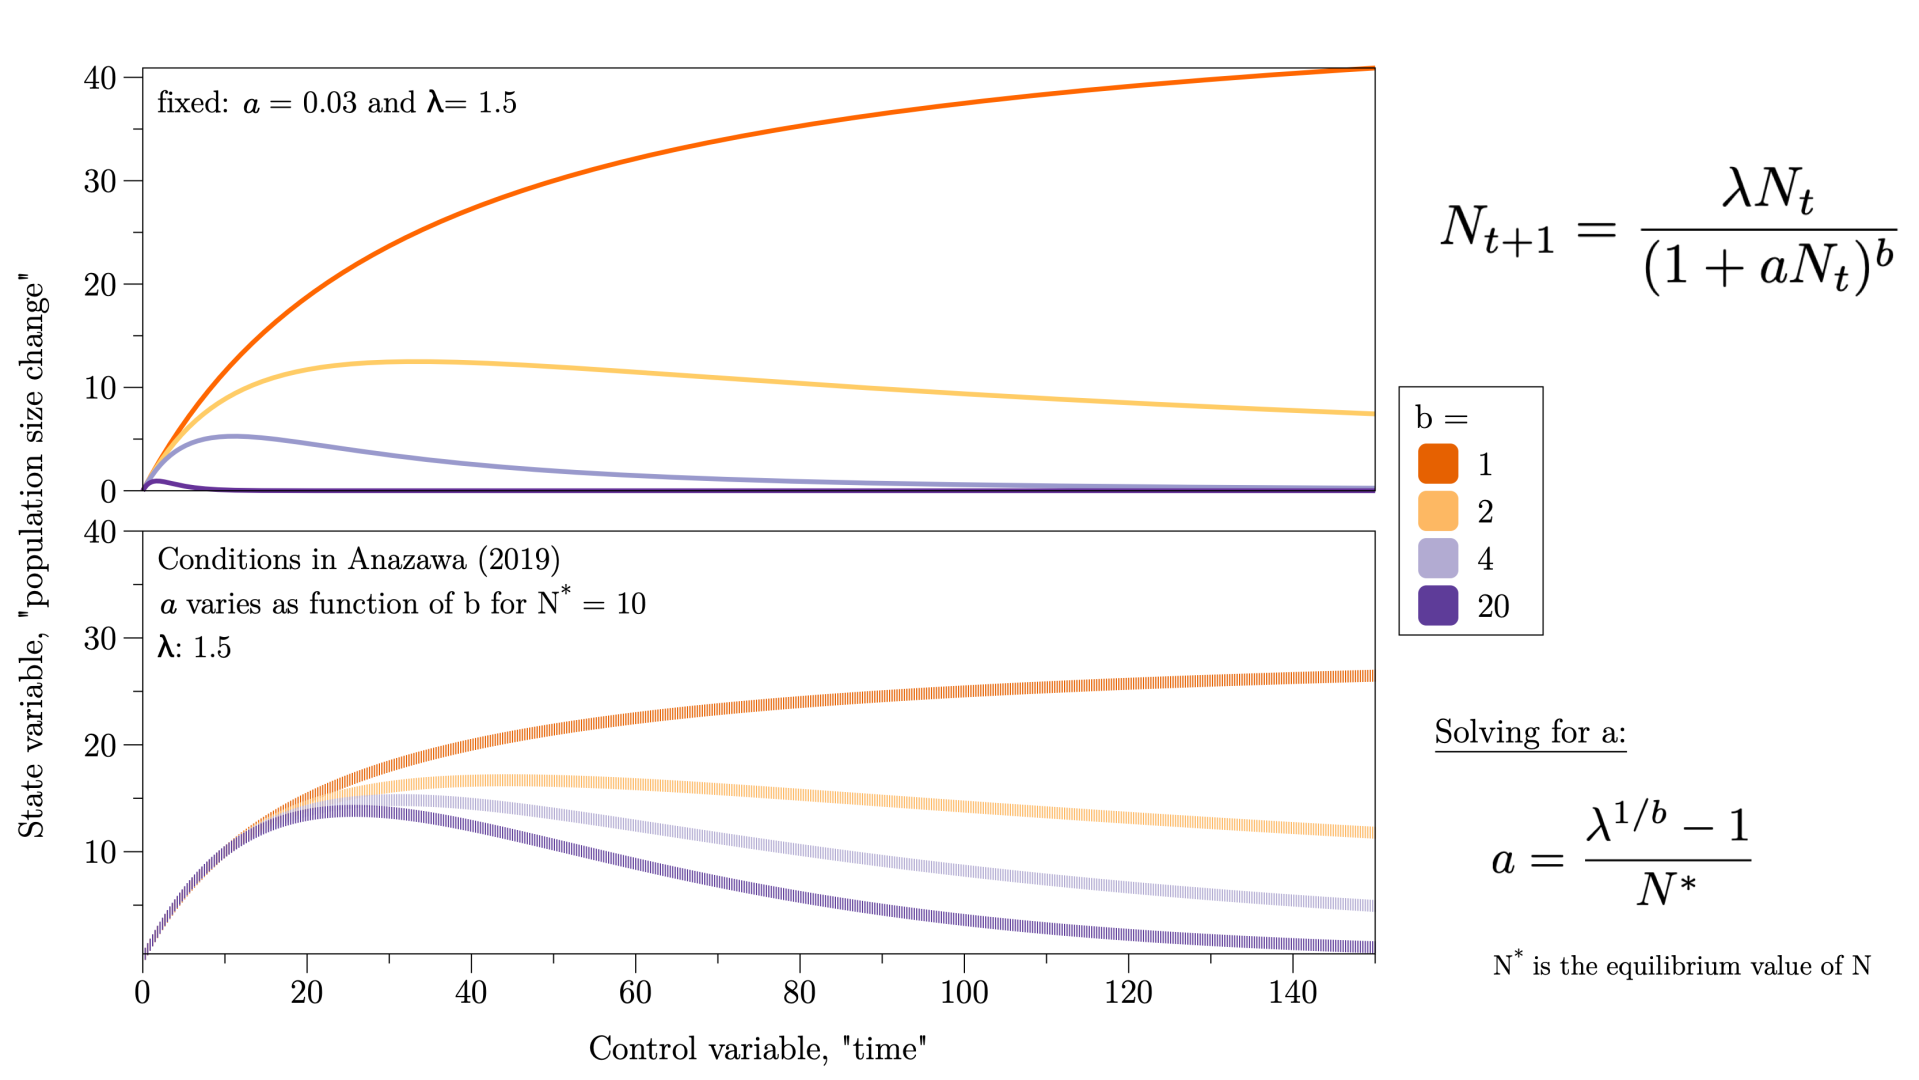
Here’s an example image – the top plot uses the plot function (where I set the colors manually) and the bottom one is built with the cross-model example available in the online examples …Jennifer
 February 18, 2025 at 11:47 am #15519
 dgteamModerator
To use a global color scheme, with a line plot you can do it using a connect command (the standard plot command does not have this).
For an example, see the example file Line plot with color scheme:
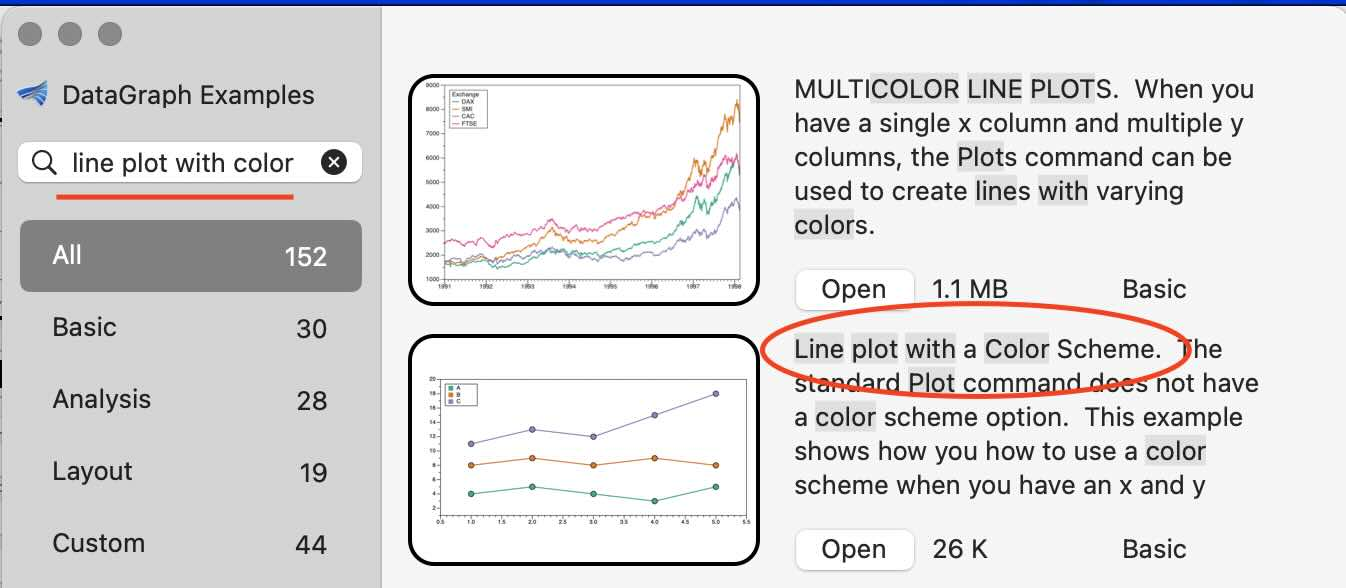
This example shows how to use the Connect command to specify each line segment and then use a column to define the line color. In the processing group, the row values are incremented by one to get each line segment in a row.
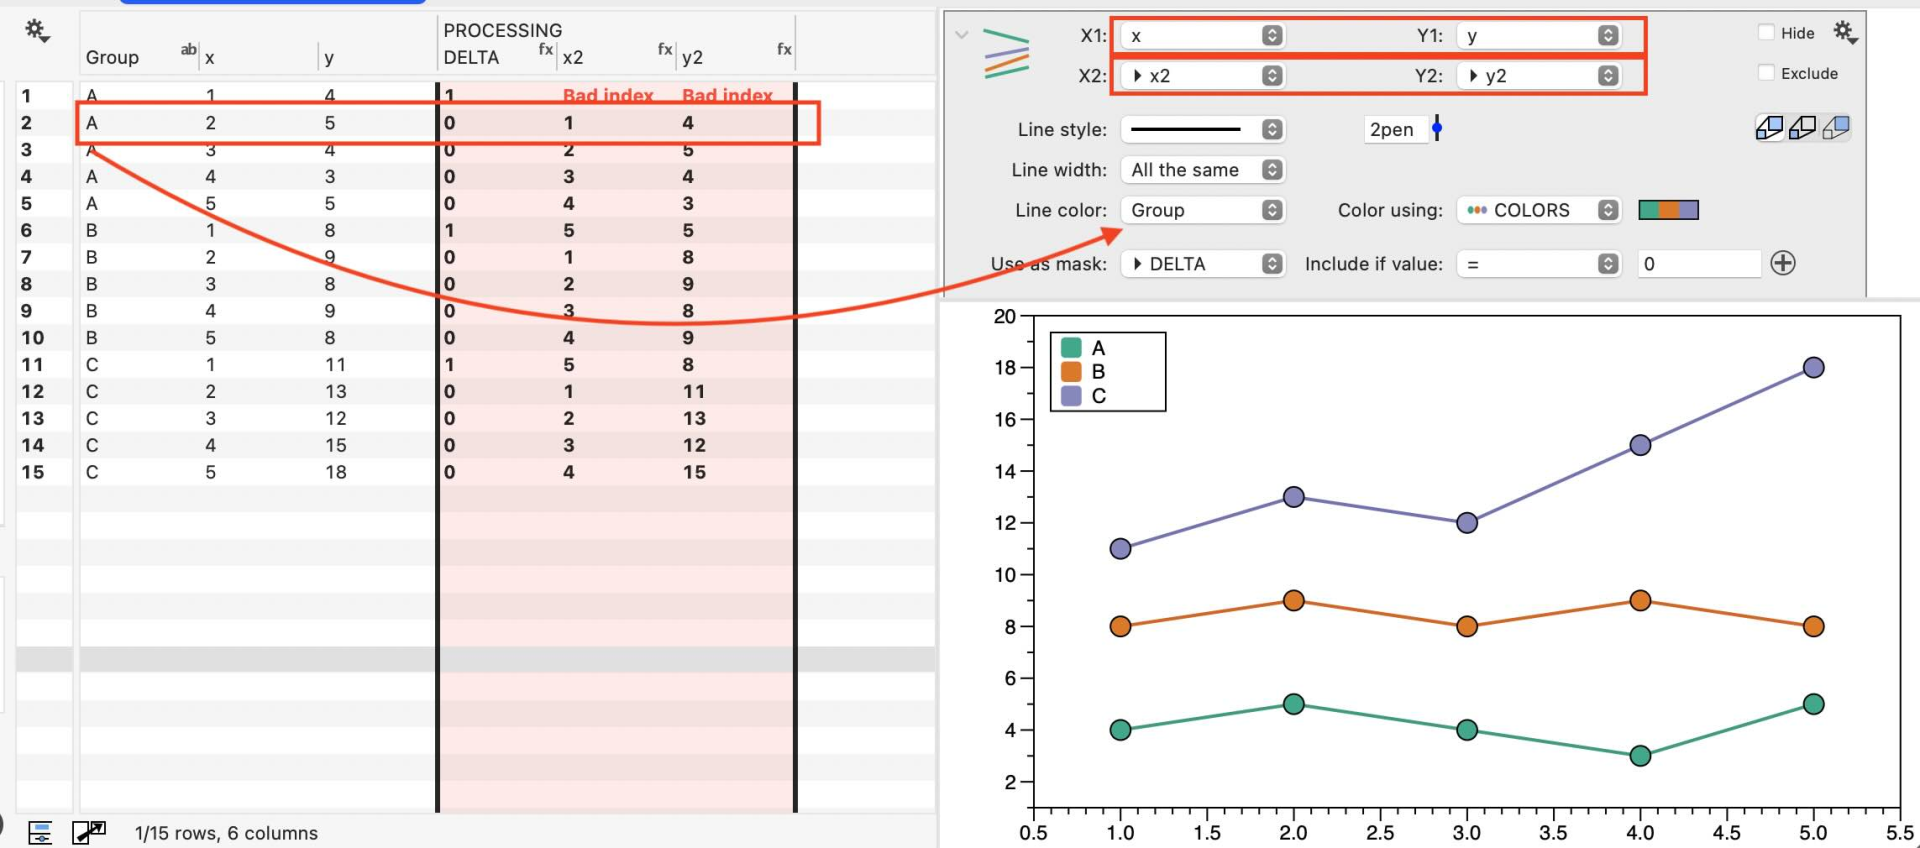
That can work, but if you plan to use one of the built-in color schemes (it looks like that is what you have here), you can use a Plots command for data with a single x column and multiple y columns.
Here is a screenshot from the multicolor line plot example. Click on the gear menu to get a list of color suggestions.
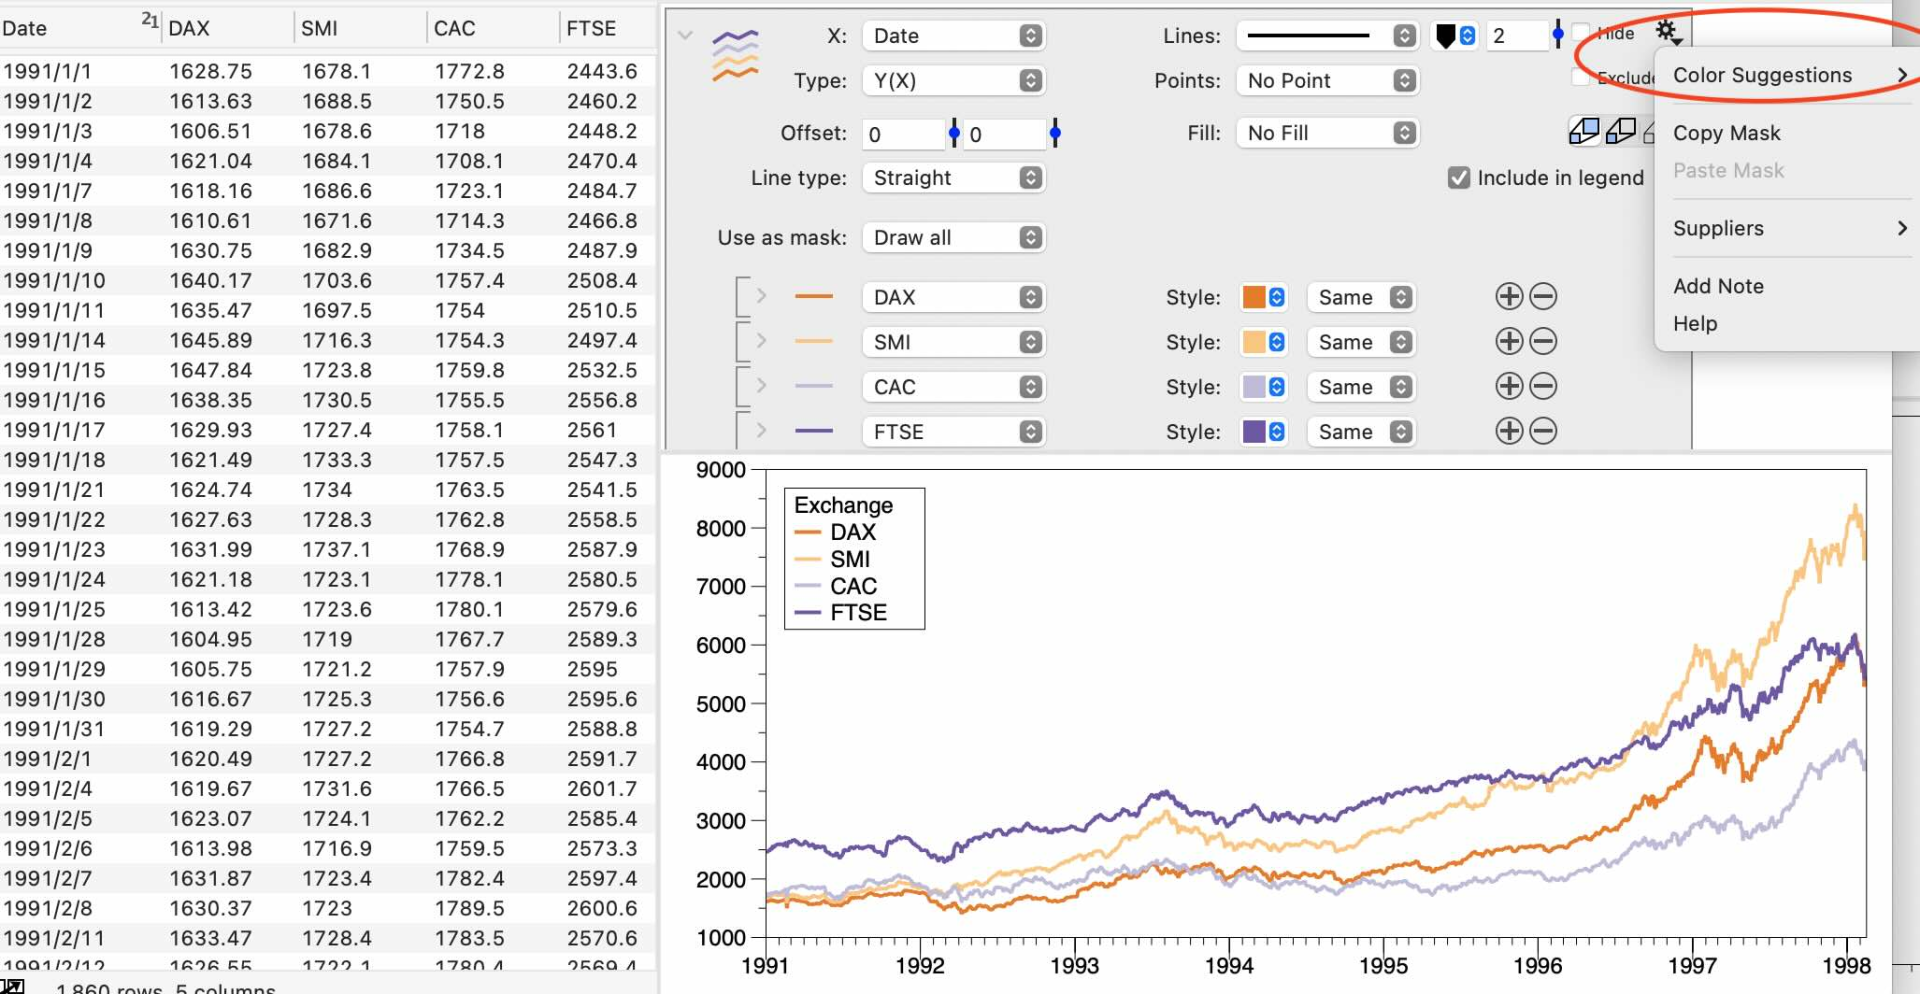
To plot your data initially with the plots command is also pretty quick. You can select all the columns, the X column, and all the Y columns at once, then add the plots command.
Do you think the Plots command will work for your data?
February 18, 2025 at 12:28 pm #15520ParticipantHello ! Yes – I did try out that example, that’s partly how I did an earlier version of the lower plot.
But the upper plot uses the function command only – no points. That’s where I couldn’t get the color to associate with a global color scheme – what am I missing ??
Jennifer
 February 18, 2025 at 1:37 pm #15521dgteamModerator
Ah, sorry, I misunderstood. The function command does not have a color scheme option, but you could use the Functions you have set up and evaluate them in the data table. Then use the Plots command.
Note that you could use an expression to perform the calculation in the data table, but since you already have the Function commands set up, you don’t have to.
Instead, you can use a Plot action column with the option to “Evaluate” a function from a command.
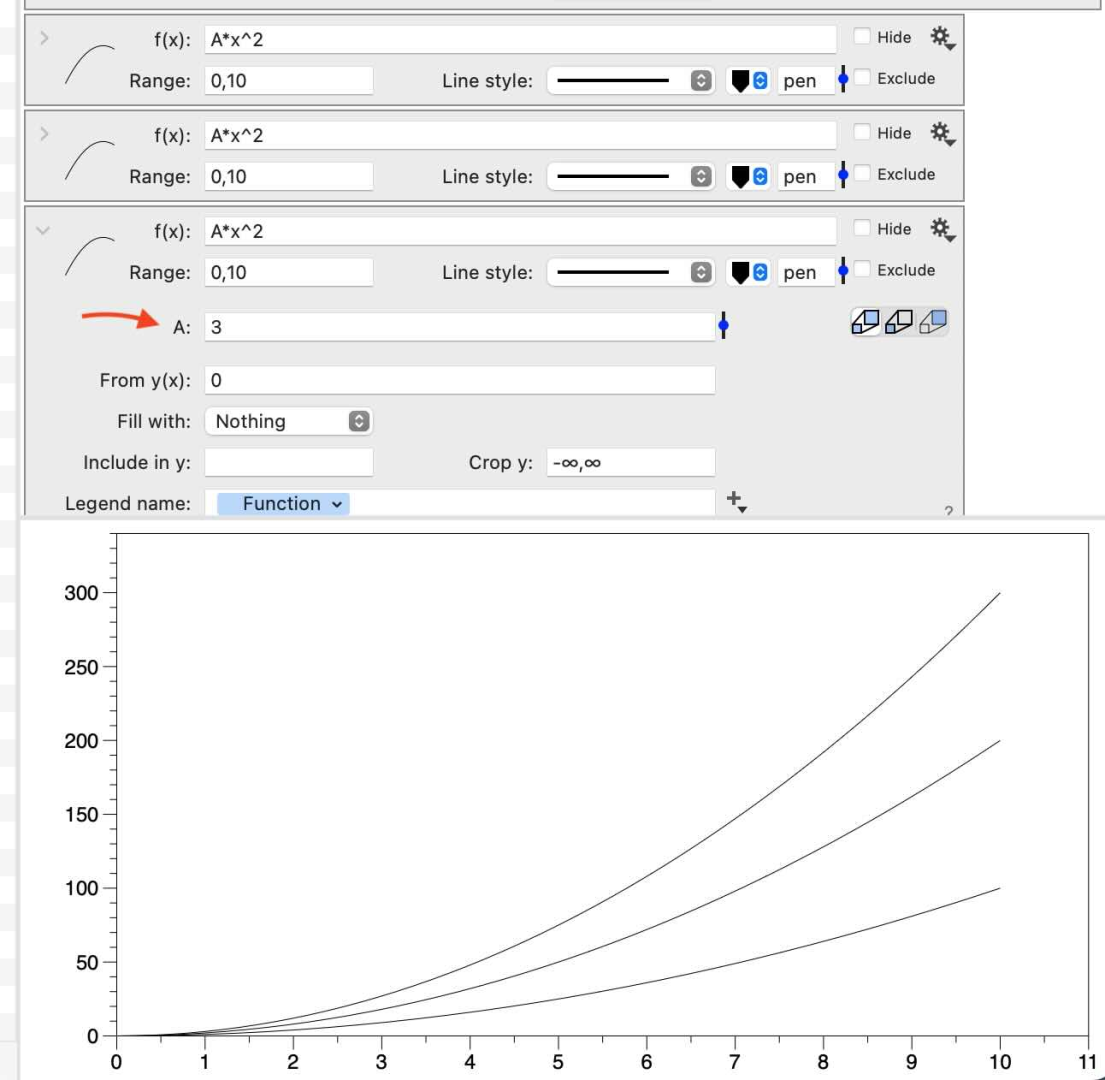
For example, three functions are drawn here, where the value for A varies.
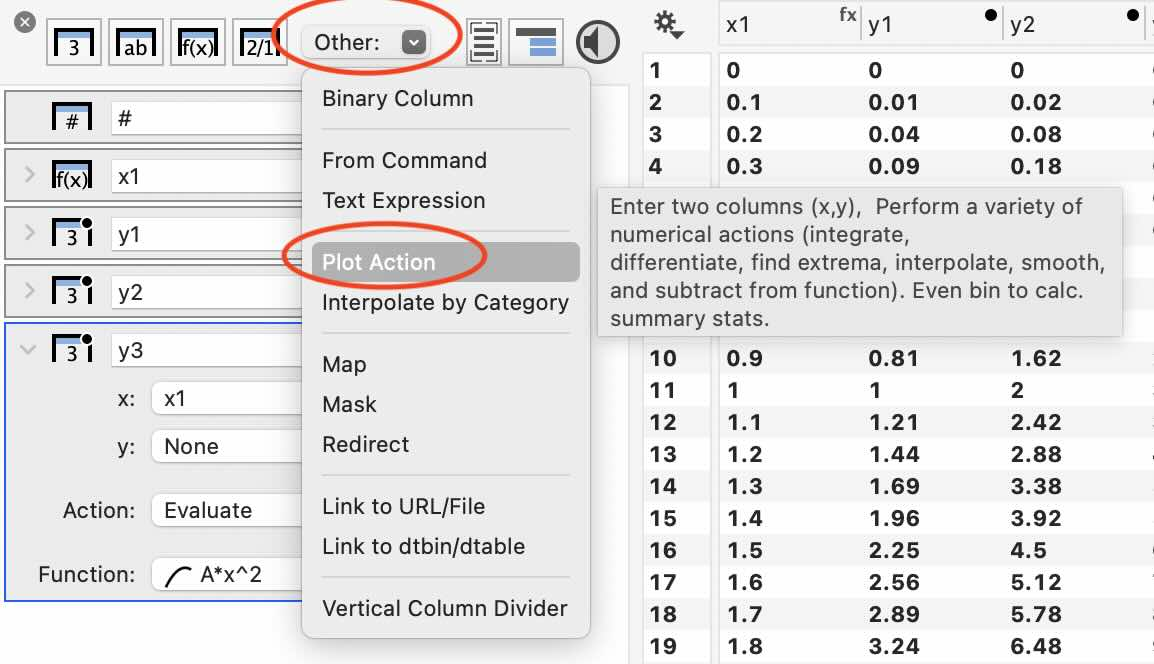
Using the Other menu, the Plot action column is added from the data side panel.
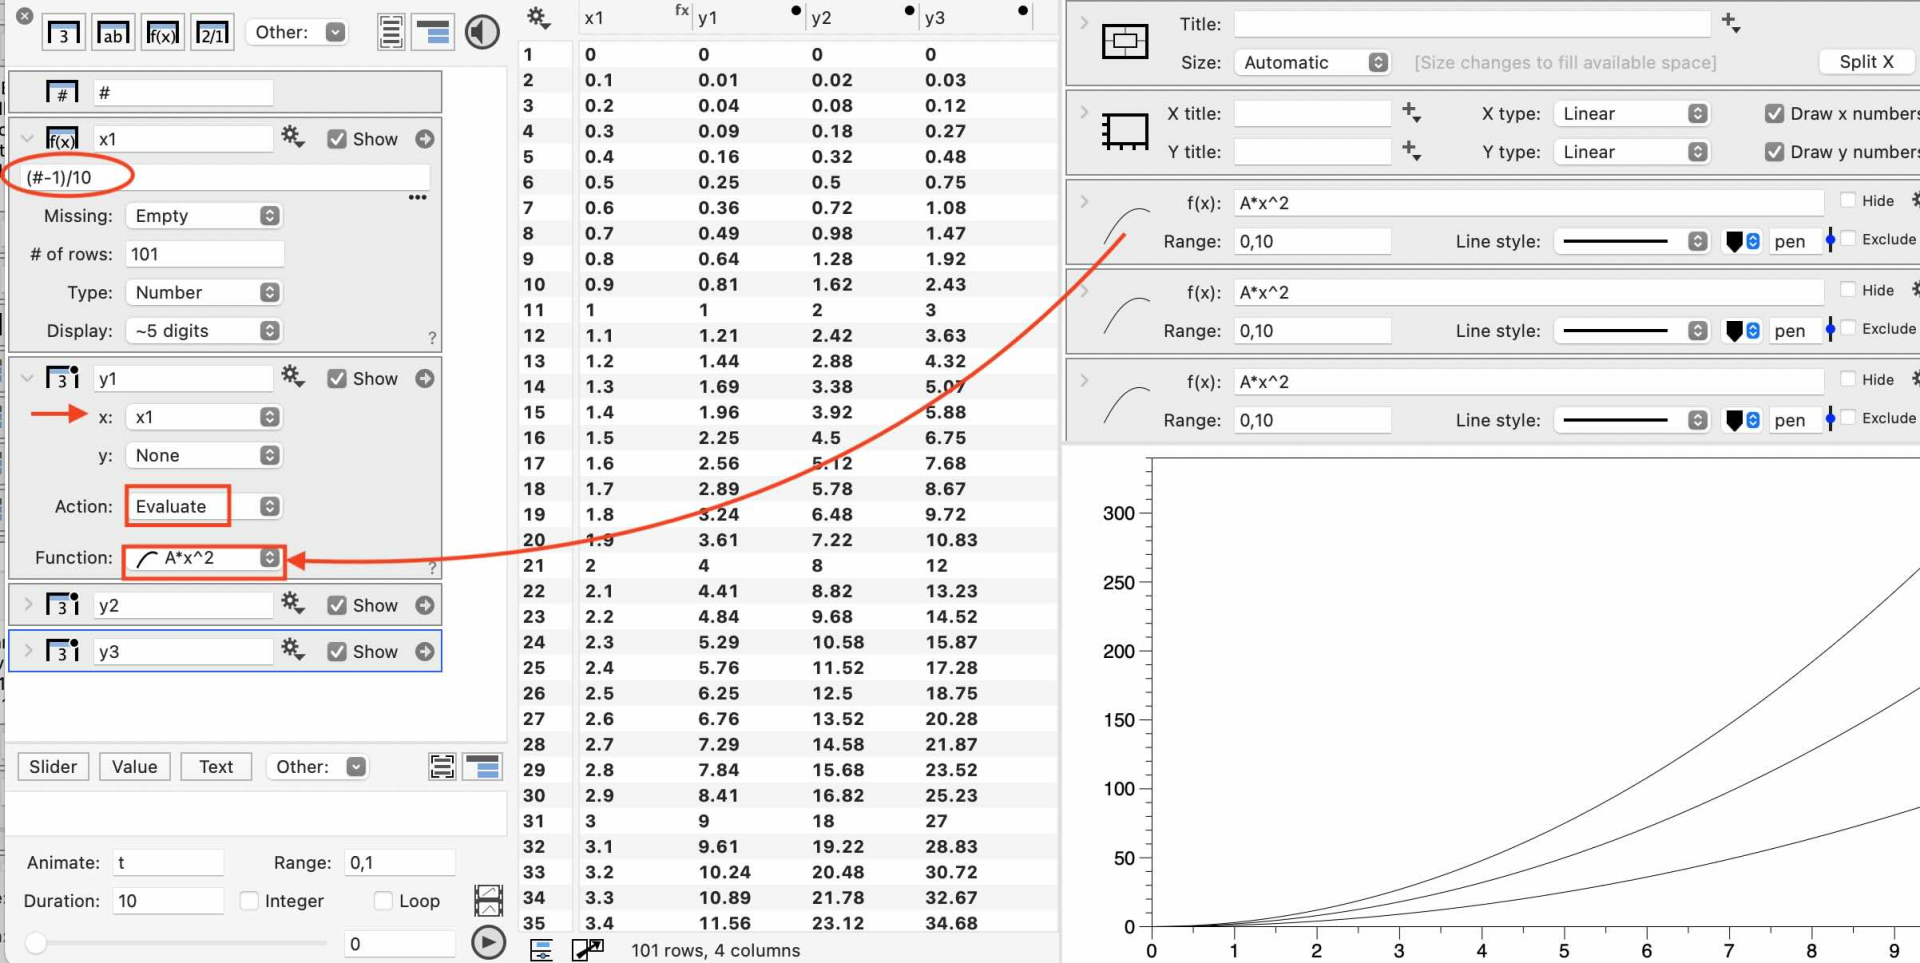
You will also need an Expression column to generate x values (here, the column x1 is set to “(#-1)/100”).
In the Plot action column, set the Action to “Evaluate”. Then, you will have a menu below to specify the function. You can use the menu or drag and drop from the function command to the menu in the plot action column.
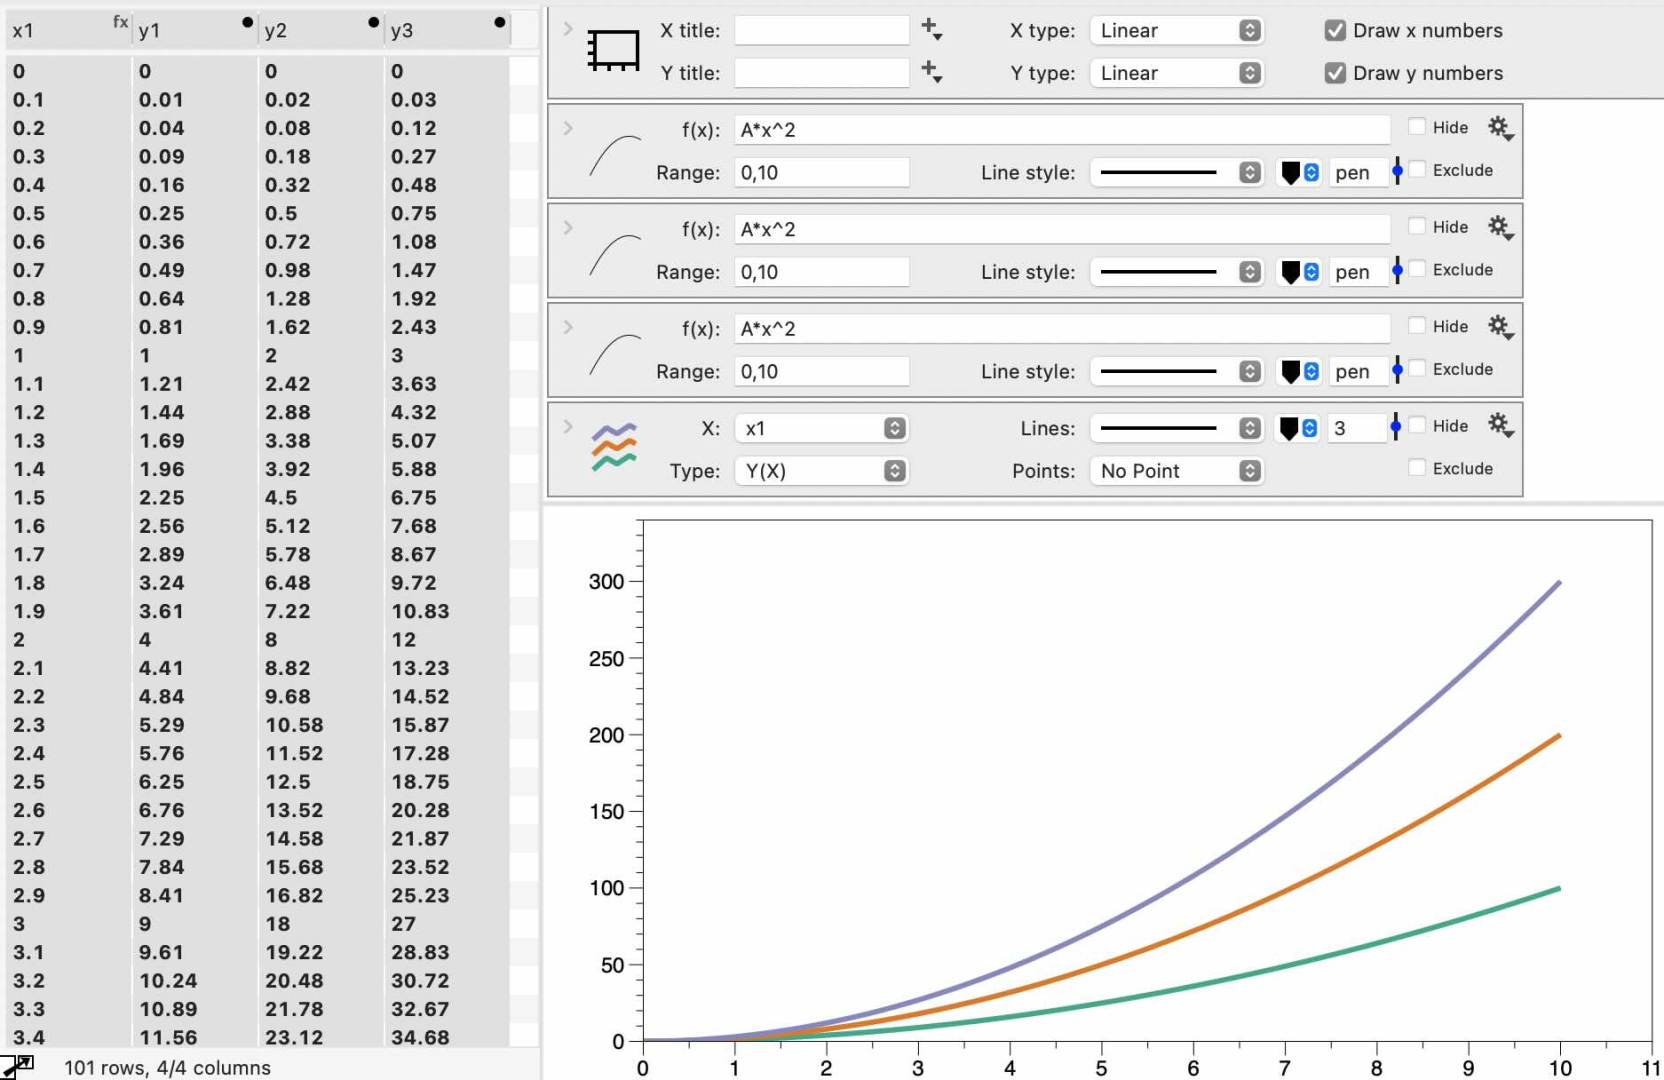
Then, select all the columns and add a single Plots command. Use the gear menu as previously described to select the color scheme.
Let us know if this works! If you are unsure, you can also email the file to our help email.
February 18, 2025 at 1:47 pm #15522ParticipantThat’s a nice trick at the end with using the multiple lines plot – that works for me – thanks ! 🙂
-
AuthorPosts
- You must be logged in to reply to this topic.
DataGraph Forums › Technical Support › Support Desk › how to use a color scheme with the “plot function” ?