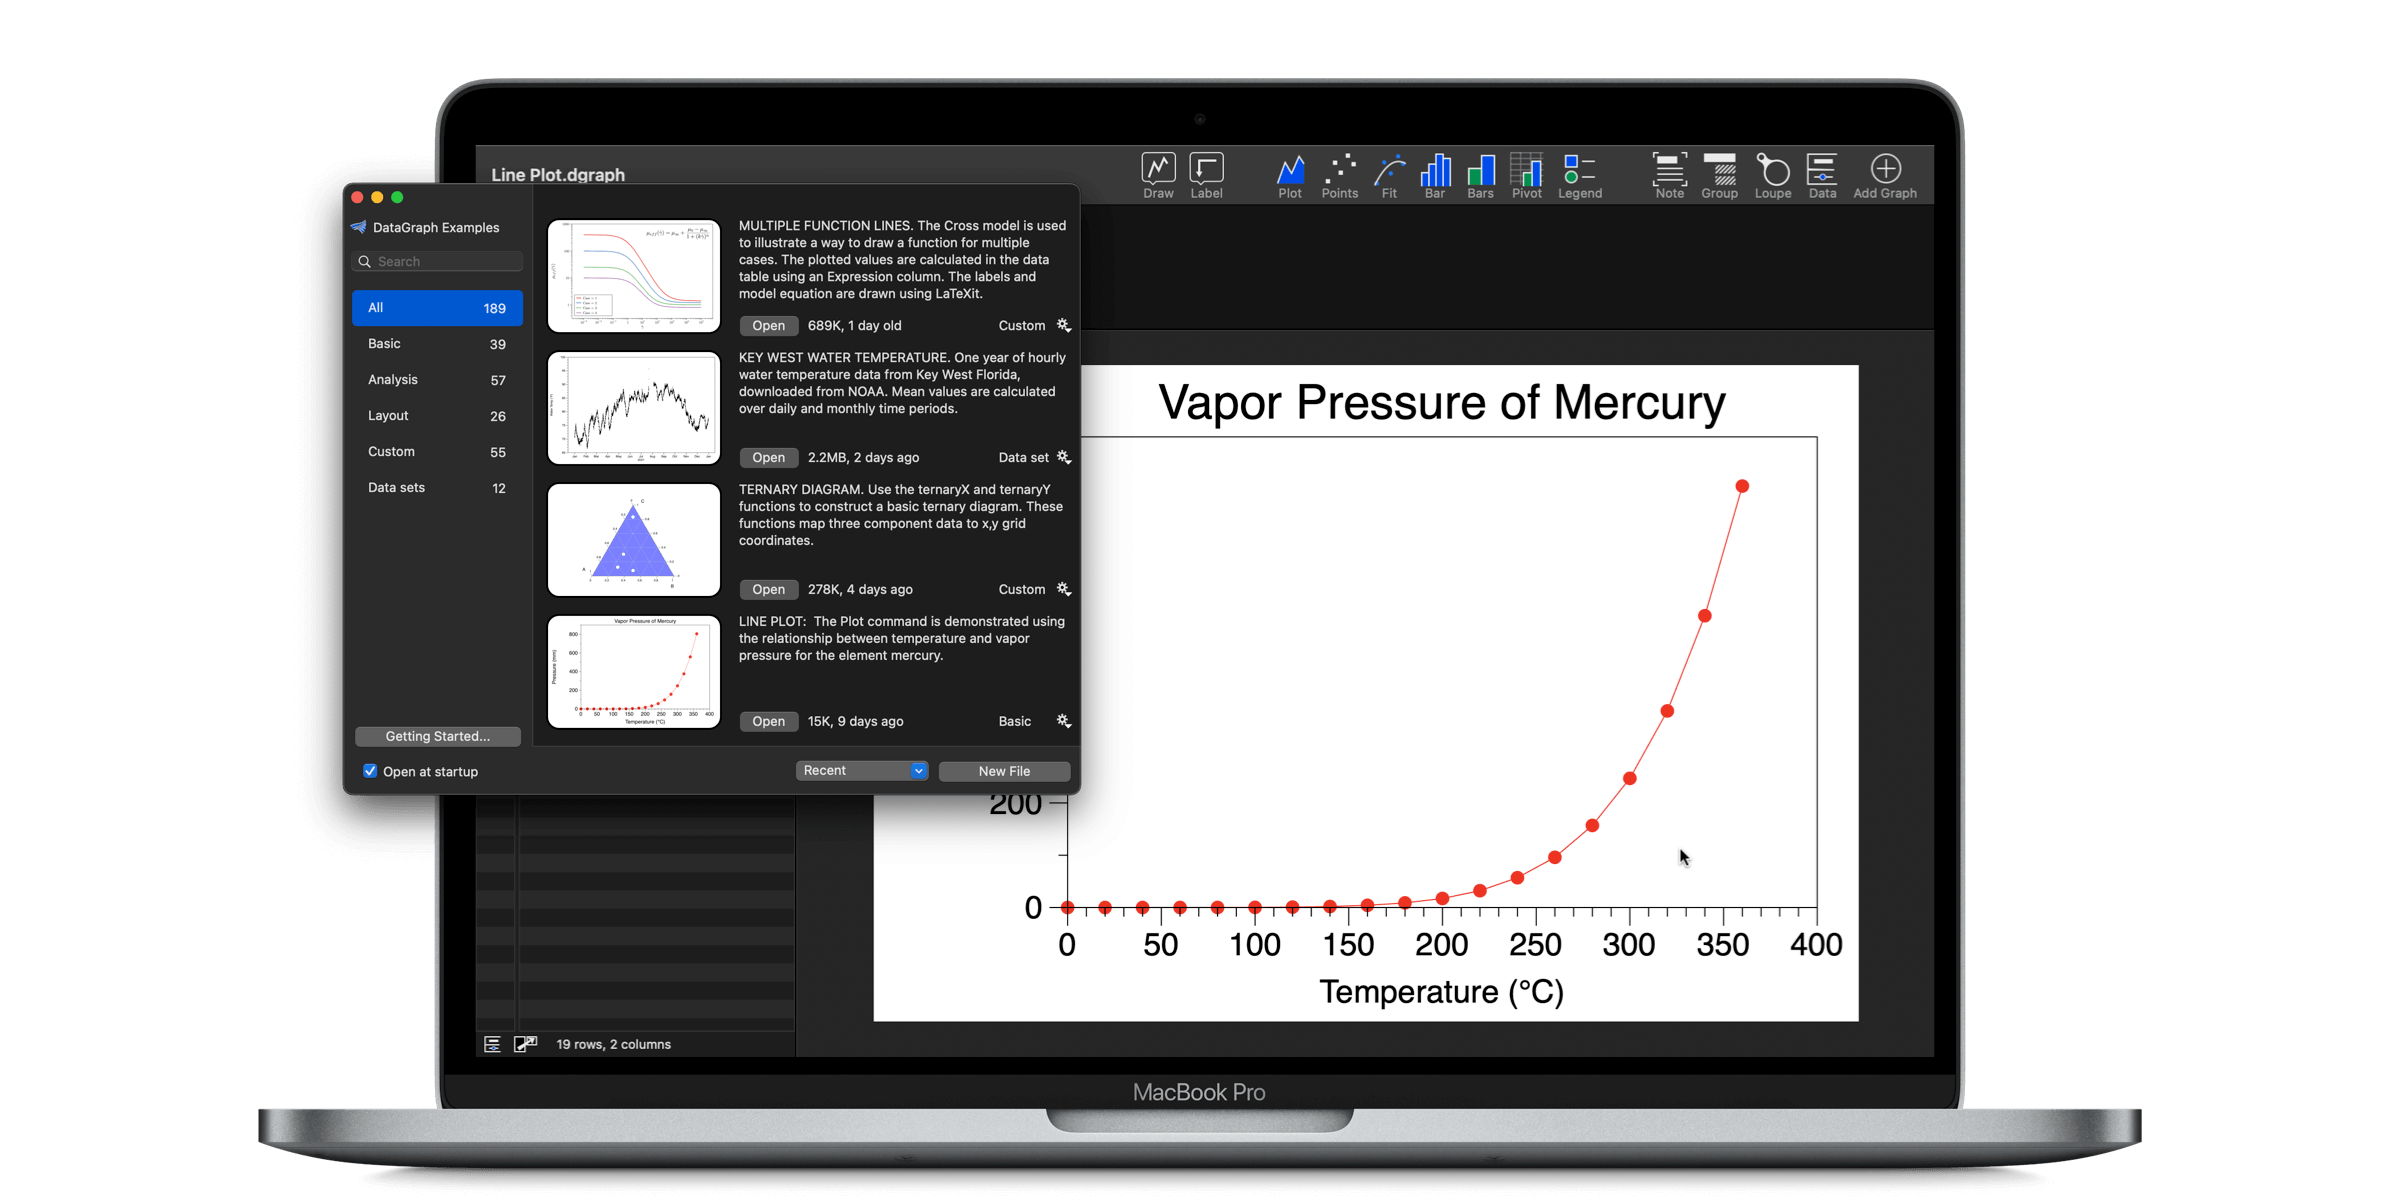
A primary goal for Version 5.0 was to make it easier for new users to get started while helping existing users to become power users! The new example file window is a big part of that effort. Version 5.0 also has a new look with a new toolbar, providing quick access to all the DataGraph drawing commands and help documents.
Webinar Series
Read a summary of key updates below or watch our webinar series, Welcome to DataGraph 5.0.
- Part 1: User Interface
- Part 2: Functions
- Part 3: Data Table
- Part 4: Commands
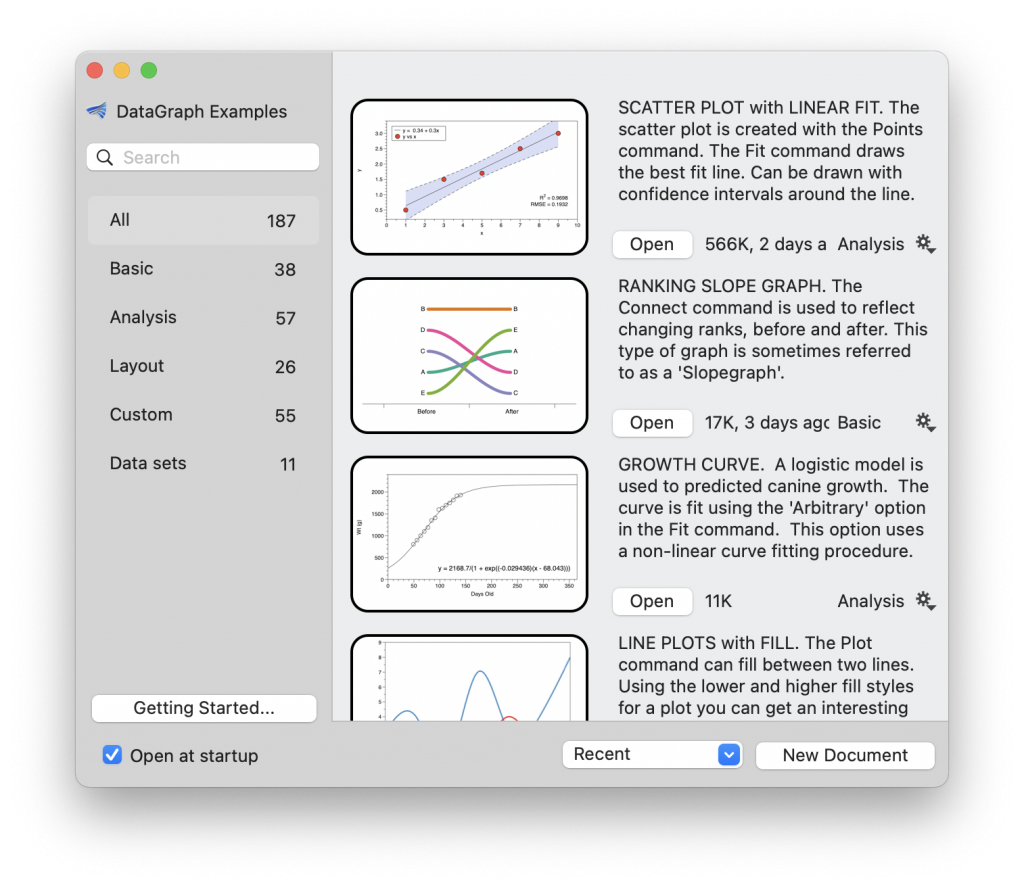
New Online Examples Window
The first change you will notice when you open DataGraph 5.1 is a new viewer for the example files. The files are now divided into a number of categories to make exploring and navigating much easier. To access the example files use File > On-line examples (or ⇧⌘N).
New Updated Toolbar
Access all the DataGraph drawing commands with two new pop-up icons: Draw and Label.
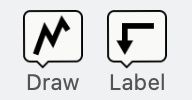
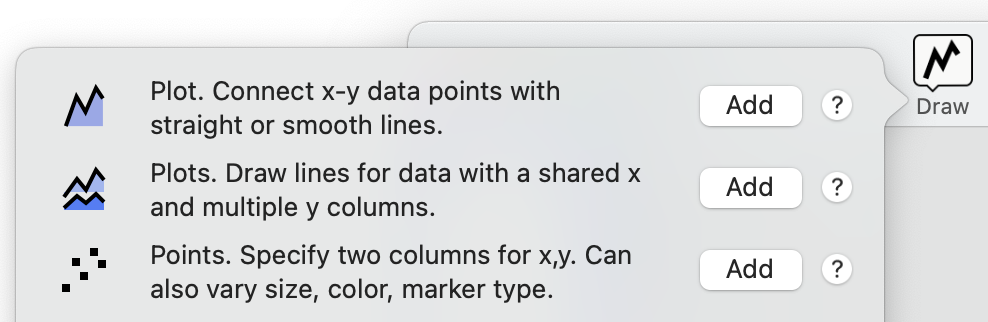
Click one of the new icons and a pop-up list appears with a short description of each command. Click ‘Add’ to create the command or click the ‘?’ on the right to open the online help for each command.
We also reduced the number of command shortcuts on the default toolbar. To learn how to customize the toolbar, and to add or remove command shortcuts, see Customize the Toolbar on the Community website.
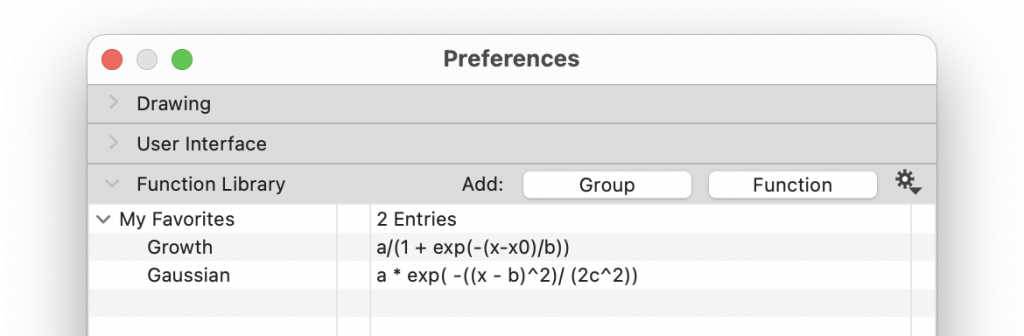
New Function Library
The new version contains a new Preferences panel featuring a Function Library. Create your own custom list of functions that are accessible through the Fit and Function commands, the Expression column, and the Expression variable. Import/Export your function lists to share with other DataGraph users!
Open the new preferences panel using the menu bar DataGraph > Settings.
More by Request
Show/Hide Multiple Columns
Added an option to show/hide multiple selected columns or groups in the table. Faster than clicking on each box. Select columns in the data table or data panel and use the gear menu in the top left corner of the data table to hide.
Share Data & Notes using Excel
If you export your data into an Excel document (File > Export Data), the Pop-up Notes are now exported in a separate tab.
Draw an Ellipse with the Region Command
The Region command now has an ellipse option. For more information, see Region command.

Release Notes
Click here to view the full release notes.