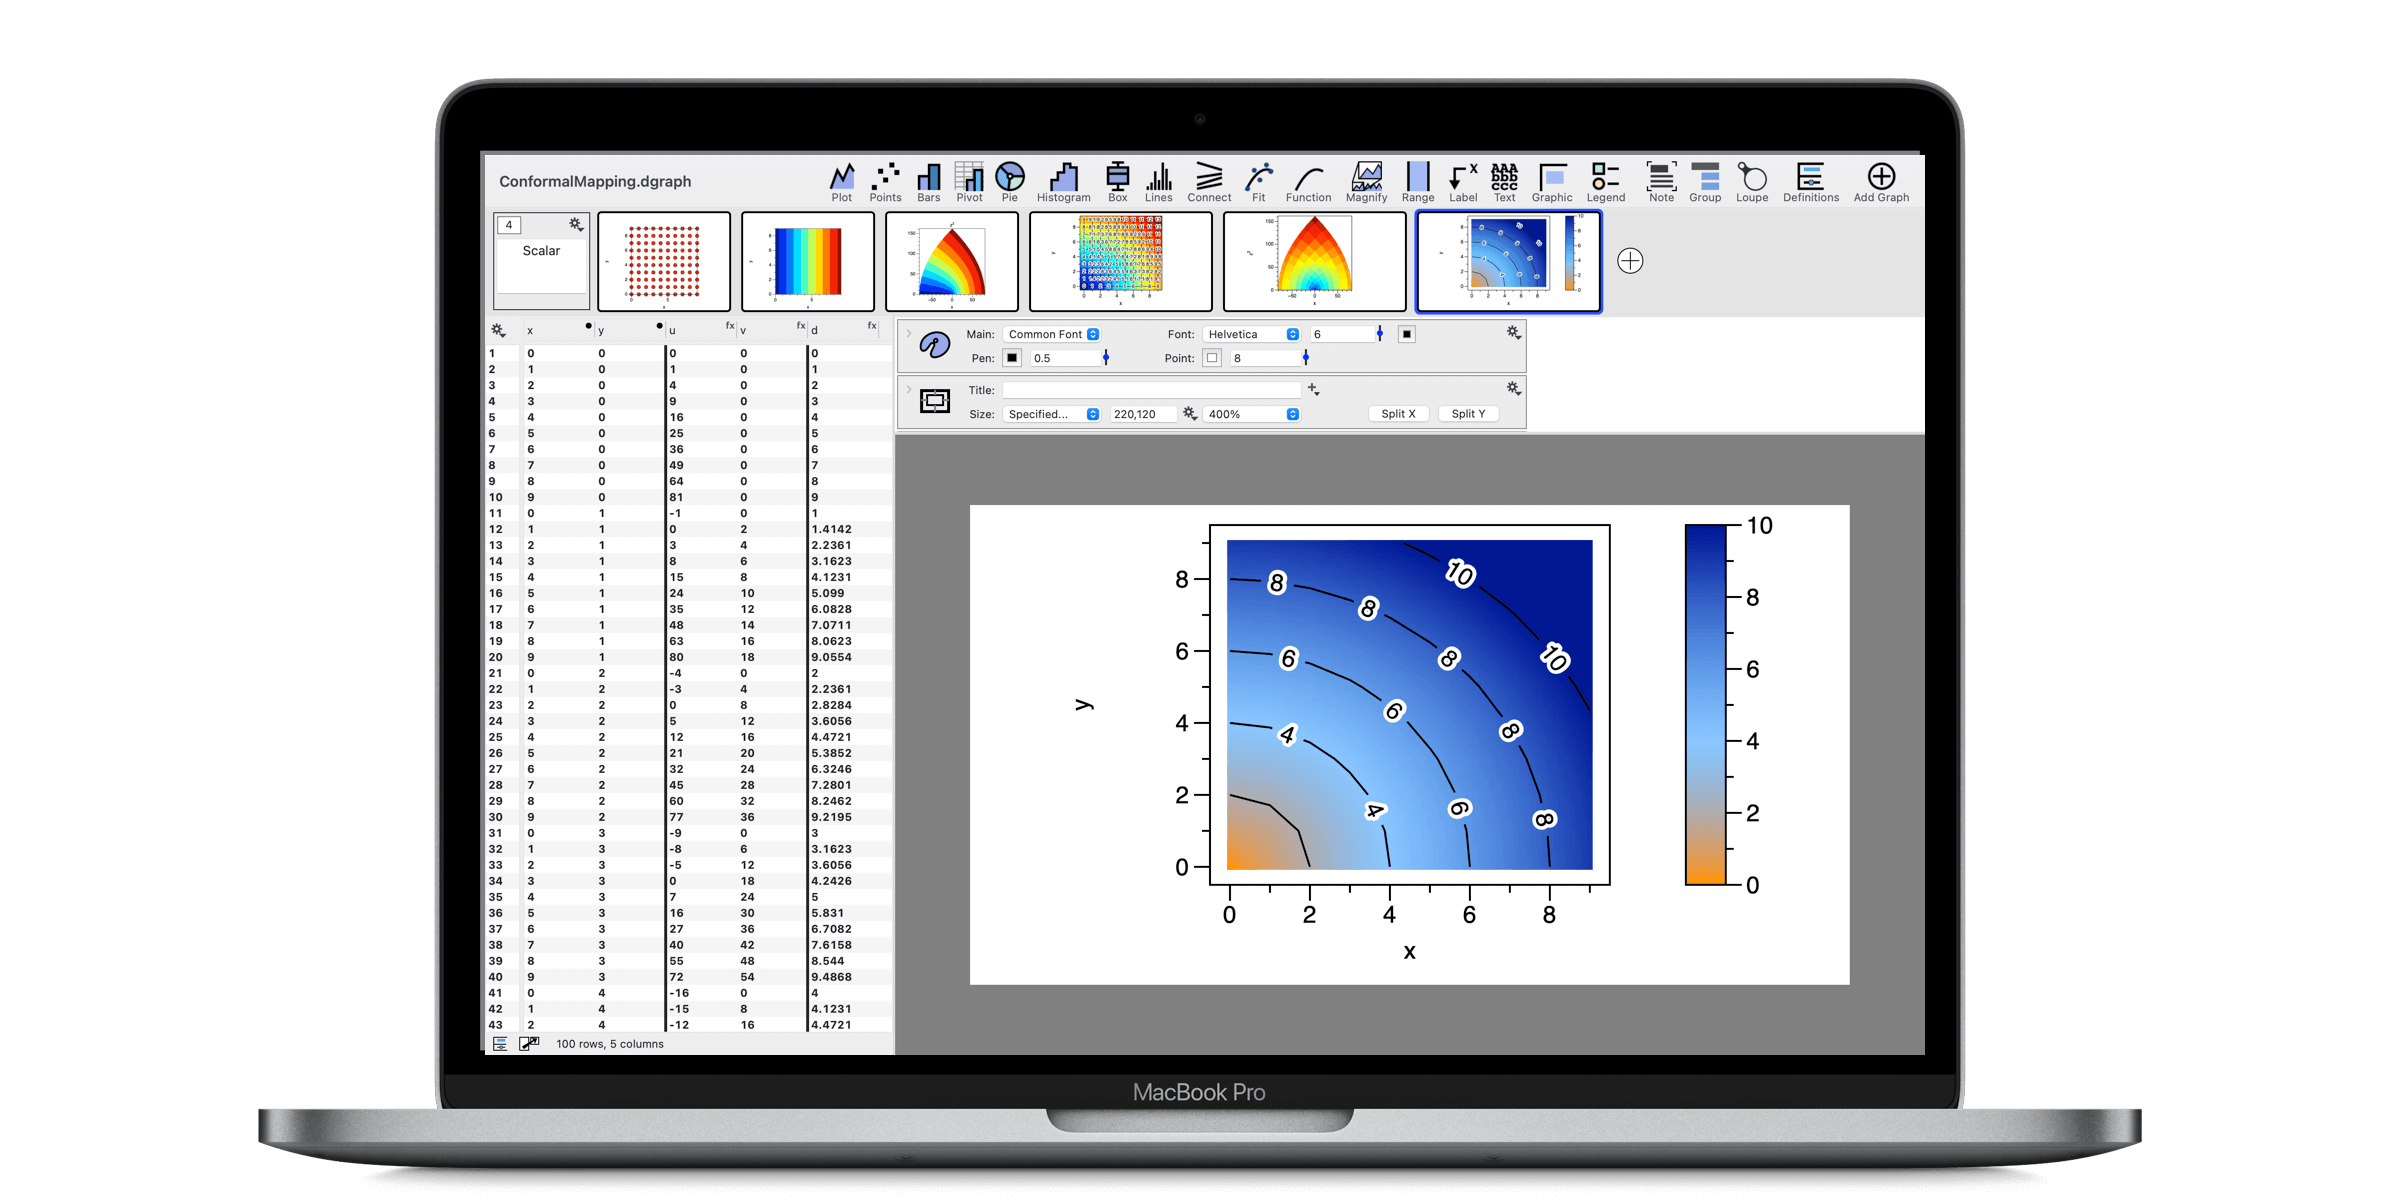
DataGraph 4.7 is a significant update that works better and has a number of important tweaks and useful additions. This version features a new scalar field command and pop-up notes. We also added new options based on user’s feedback, such as text outlines for labels and drawing intermitting points in line plots. Enjoy!
Key Features
- NEW! Scalar Field command
- NEW! Pop-up Notes for columns, variables, commands, and groups
- NEW! Text outline for Text and Label commands
- NEW! Quick Graph for Text Columns
- New! Plot Intermittent Points Option
Many other improvements and fixes throughout based on user comments and feedback including:
- Added standard errors for the arbitrary fit option in the Fit command (non-linear fit).
- Added Format options when labels are based on text columns. Applies to the Points, Plot, Lines, Connect, Bar, Pie commands. Options are ‘Automatic’ or ‘Raw Text’.
- Added a label position “End” to the Bar command to match the “End” option for the Bars command.
- Improved the color scheme when you use dates.
- Increased the ‘slice’ limit for the Pie command.
- Added a way to export a dtable file.
Webinar
In September of 2021, we demonstrated many of the features in version 4.7 during a live webinar. Watch a recording of the webinar here or read summaries of the features below.
Scalar Field command
DataGraph version 4.7 includes a new command to draw scalar fields, also known as heat maps. The command includes many useful annotation options, including grids, labels, and contour lines.

The Scalar field command has a lot of flexibility to draw uniform or nonuniform grids. You can even draw grids that produce other shapes (i.e., conformal mapping). More details are in the Scalar Field command documentation.

Check out the full documentation here: Scalar Field Command
For a shorter tutorial see: Scalar Field Basics
Examples: Scalar field Examples
Pop-up Notes
Another addition is the new Pop-up notes feature. This gives you an easy way to document your work, while limiting the clutter to your work space.
Pop-up notes give you a new option for adding documentation to data columns, variables, commands, and groups. To create, click the gear menu on any of these objects and select Add Note.

Also, pop-up notes and standard comment blocks will now autodetect URL links.

Outline Options for Labels
To make your text annotations POP, text labels have a new outline option. Adding an outline color makes is much easier to read text that overlays graph elements or images. Control the color and the width of the outline. The font outline is available in the Text, Label, Points and Scalar field commands.

Quick Graph for Text Columns
Quick graph has now been updated to work with text columns. To use, highlight a text column and hit the space bar. A pop-up window will appear that shows a count of each unique text entry.

Plot Intermittent Points Option
The Plot command has a new option that allows you to show points at intermittent locations along a line. Specify the interval using a value, a variable or adjust with a slider.
Other Fixes
Here are a few other fixes to round out this version.
- Text From Column variable now works properly when getting the name of a redirected column.
- 5% and 10% padding for a date axis will not treat Jan 1st 1970 any differently.
- The space for X and space for Y now is used even if there are no tick marks drawn if you specify the space exactly. Medium, Narrow etc is based on the font size and with no tick marks that space is 0.
Release Notes
Click here to view the full release notes.
