How to? Table of plotted X,Y data drawn on graph
DataGraph Forums › General › Getting Started › How to? Table of plotted X,Y data drawn on graph
- This topic has 4 replies, 3 voices, and was last updated 1 year, 9 months ago by
 dgteam.
-
AuthorPosts
-
January 29, 2025 at 8:28 pm #15412
kirkt
ParticipantLet’s say I have an XY plot of 20 pairs of data. I can add labels to the data to specify the Y values, for example, at each point on the plot next to the drawn marker.
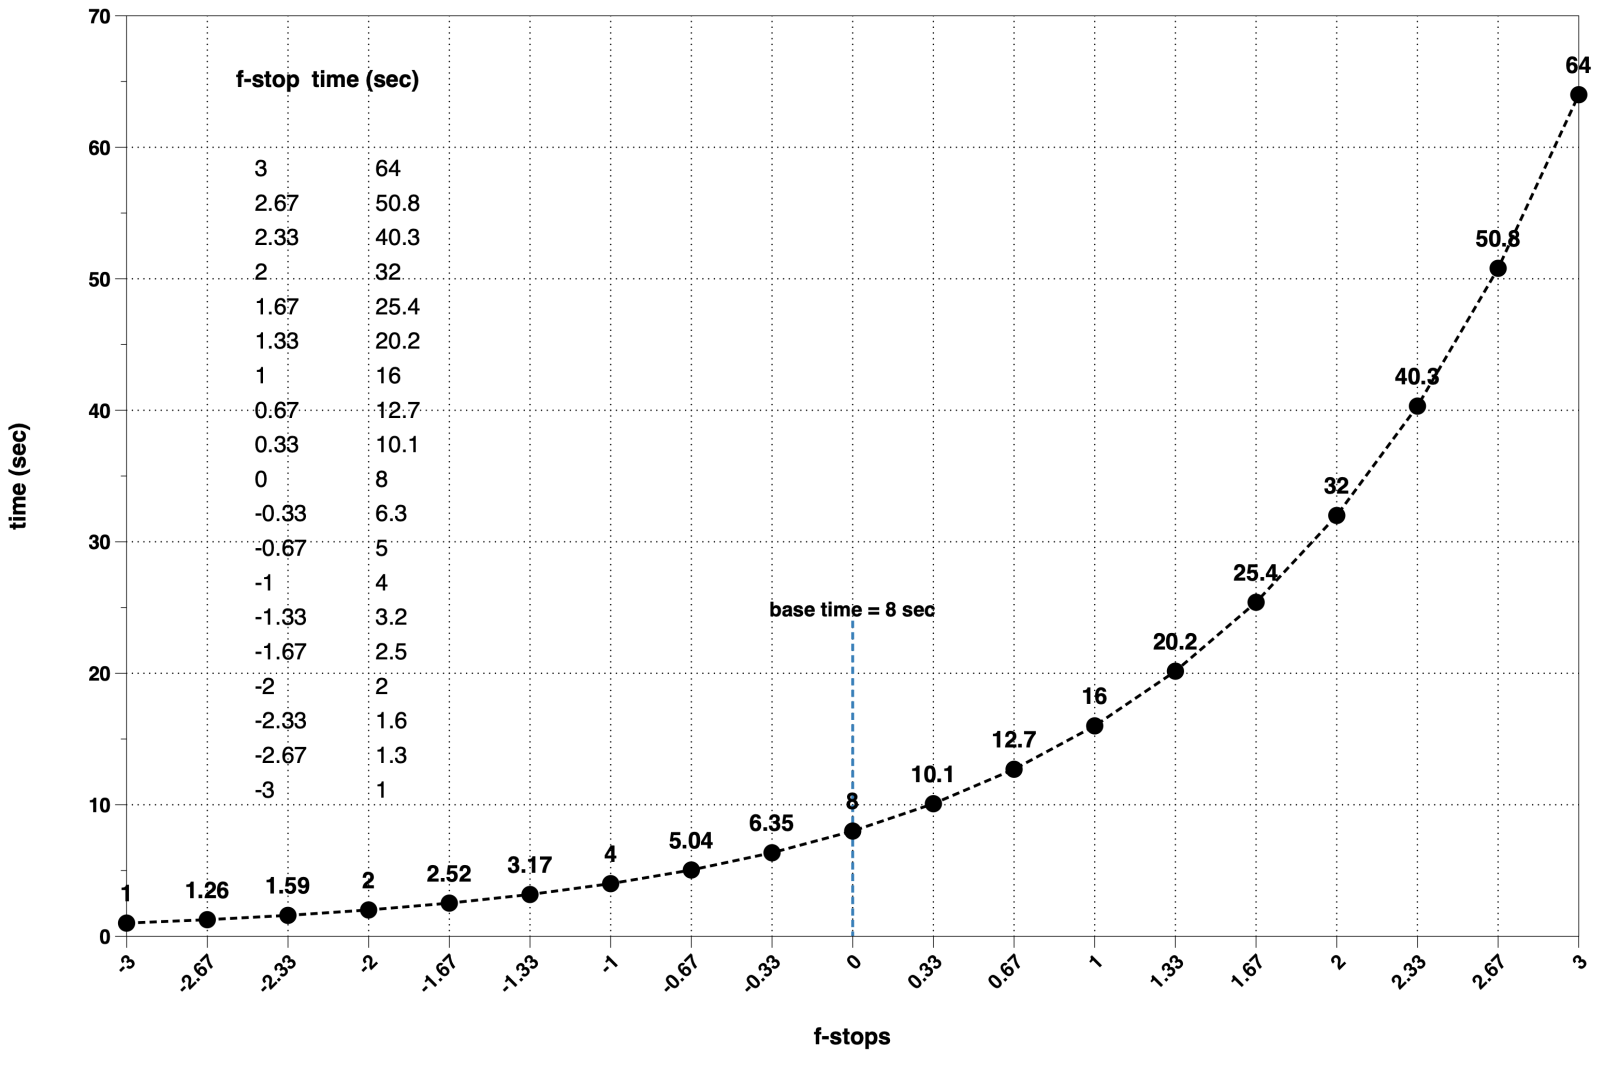
What I would also like to do is draw, on the plot itself, a 2 column by 20 row table of the XY data pairs, with the column names as headers to this table. I would like the table to update as I change parameters that change the XY data pairs.
Is this possible in a straightforward manner? I kluged it together by using the XY data as labels for a set of data points that I made to form two columns of points, with no markers displayed. However, there is all sorts of scaling and positioning chaos as I change the parameters that affect the range of the X and Y axis (when the XY data changes in response to changes in variables).
Thanks in advance!
Kirk
PS – this is an exercise to determine exposure times for darkroom printing using a system called “f-stop printing” to determine the exposure time associated with an equivalent exposure change of a given stop of light (increase or decrease). Below is my kludged attempt to list the XY pairs parametrically with invisible XY data points arranged in two columns.
-
This topic was modified 1 year, 9 months ago by
kirkt.
January 30, 2025 at 12:47 pm #15414 dgteamModerator
Nice looking graphic!
We would suggest doing this by creating the “table” in one graph and then including it in the plot using a Graphic command. Then you can make sure that the table is sized appropriately for the size of your graph, and also anchor it to a particular corner.
In the graph where you create the table, set the margins to zero in the Canvas settings. Also, uncheck “Draw x and y” numbers on the Axis settings.
After you create the table, it is very easy to click and drag from the thumbnail into the graph that you want to include it in. This will essentially make a “dynamic screenshot” of that table. For a quick demo, check out the documentation on the graphic command. There is a Gif that demonstrates how to drag from one thumbnail into a graph. You can also set it up manually, but the drag-n-drop is really nice 🙂
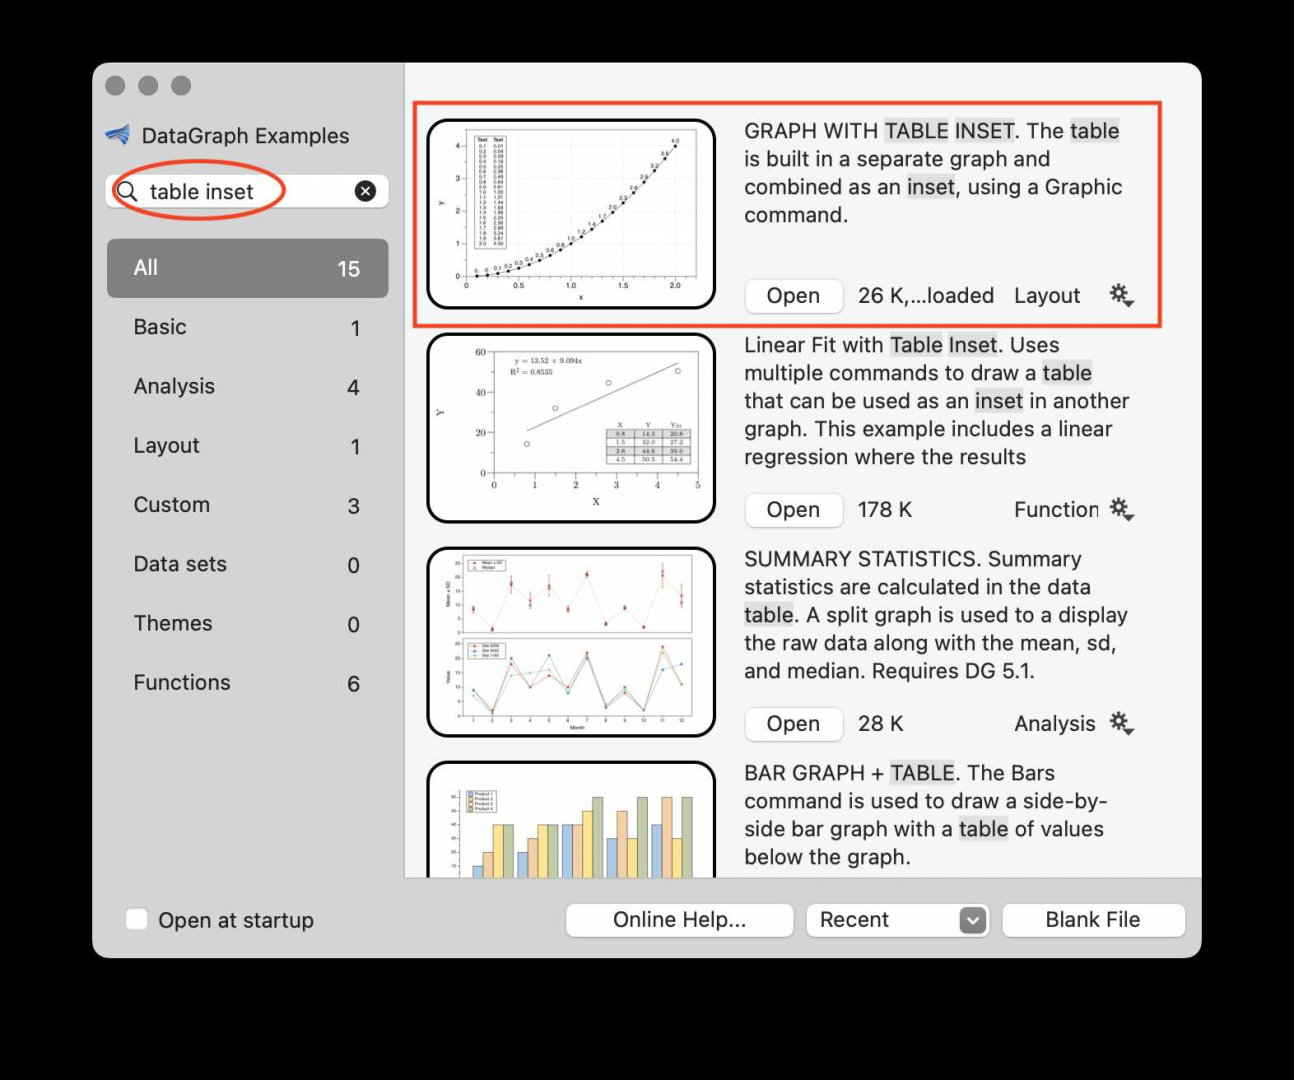
We also added a new example file, with similar data, to illustrate. Search on table inset to see that and other similar examples. There is also a table with inset on a linear fit example, you might want to check this one out too. It has slider variables to dynamically change the number of columns, but it’s a bit more complicated than the simple table.
Doest this help?
January 30, 2025 at 1:29 pm #15417ParticipantI really need to use the search functionality of the examples more often. I usually go to the manual first, but this is terrific. Thank you for your response, I will give it a try and see how it works!
Kirk
January 30, 2025 at 6:12 pm #15418ParticipantI tried opening the example at the top (most recent) of the list. The thumbnail of the plot is the one shown in your screenshot, but nothing happens when I click the “Open” button.
I am using DG v5.4
Kirk
January 30, 2025 at 6:29 pm #15419dgteamModeratorAhhh! Sorry I was using a file in the *.dgraphs format (which we recommend using if you are saving on a remote drive) but this is not yet compatible with our example files. My Bad!
Please try now.
-
This topic was modified 1 year, 9 months ago by
-
AuthorPosts
- You must be logged in to reply to this topic.
DataGraph Forums › General › Getting Started › How to? Table of plotted X,Y data drawn on graph