Histogram with color scheme

DataGraph Forums › Technical Support › Support Desk › Histogram with color scheme

Viewing 5 posts - 1 through 5 (of 5 total)
  • Author
    Posts
  • #15789
    dmweaver
    Participant

      I would like to prepare a smooth histogram to which I can apply a color scheme, rather than a solid colour. The result would be that different parts of the histogram would be coloured differently dependent on the thresholds specified in the color scheme. Currently there is no option to use a color scheme in histograms. It doesn’t seem possible to use masks to achieve the result as this simply results in different datasets rather than a single dataset to which different colours are applied.

      #15790
      Jean-Yves Le Stang
      Participant

        Hi,

        Not sure to understand your need; what about applying a “gradient” colour option to a “smooth” histogram or a colour scheme to a bar graph (bar graphs allow for colour schemes but do not have “smooth” option)

        #15791
        kirkt
        Participant

          There is a choice in the drop down menu item “Type” for a histogram command that specifies “Smooth” with a slider called “Width” that permits specifying the amount of smoothing (the effective binning that is used).  There is a “Fill with” option called “Gradient” that permits a 2 or 3 color gradient – with the three-color gradient chosen, there is a slider/value field that permits setting the midpoint of the gradient, permitting shifting the gradient toward one end of the range of values, based on the maximum value of the histogram.

          Try this and post the resulting histogram graphic  with notations related to what you would like to achieve differently or in addition to what is currently available.

          Kirk

          #15792
          dgteam
          Moderator

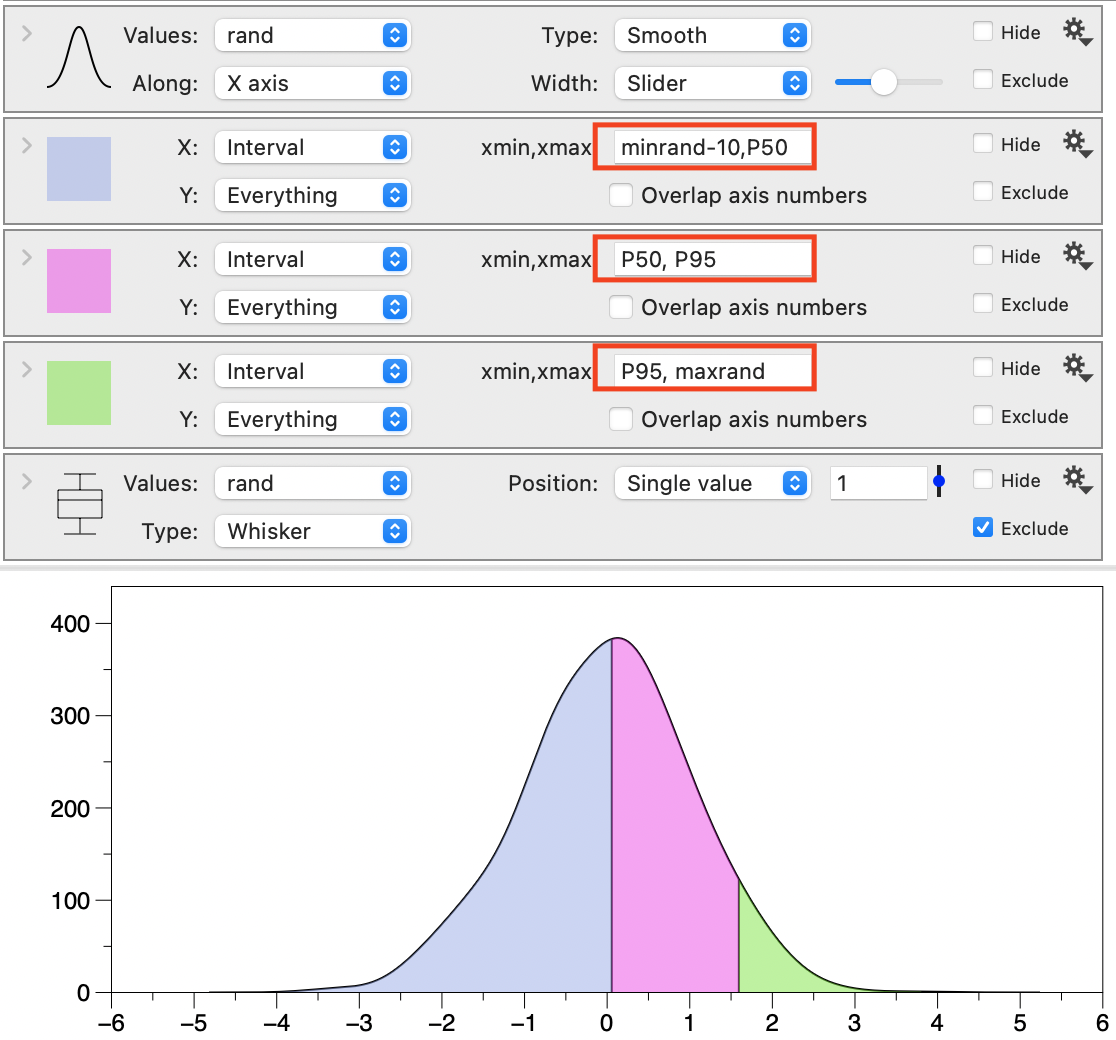
            Perhaps one option that would work is to combine the Histogram with a Range command. You can manually set the range you want to fill based on the x values and use the “clip with” option with the smooth Histogram.

            Clip1

            If you only want a couple of ranges, it might be easier to just have a series of commands that fill for different percentile ranges.  That is what we did here, where we are using the Box command to compute/extract the percentile values as variables.
            Clip2

            Is this getting close to what you’re looking for? The range command can also use color schemes.

            #15793
            dmweaver
            Participant

              The range command worked perfectly. Thanks very much. 🙂


            Viewing 5 posts - 1 through 5 (of 5 total)
            • You must be logged in to reply to this topic.

            DataGraph Forums › Technical Support › Support Desk › Histogram with color scheme