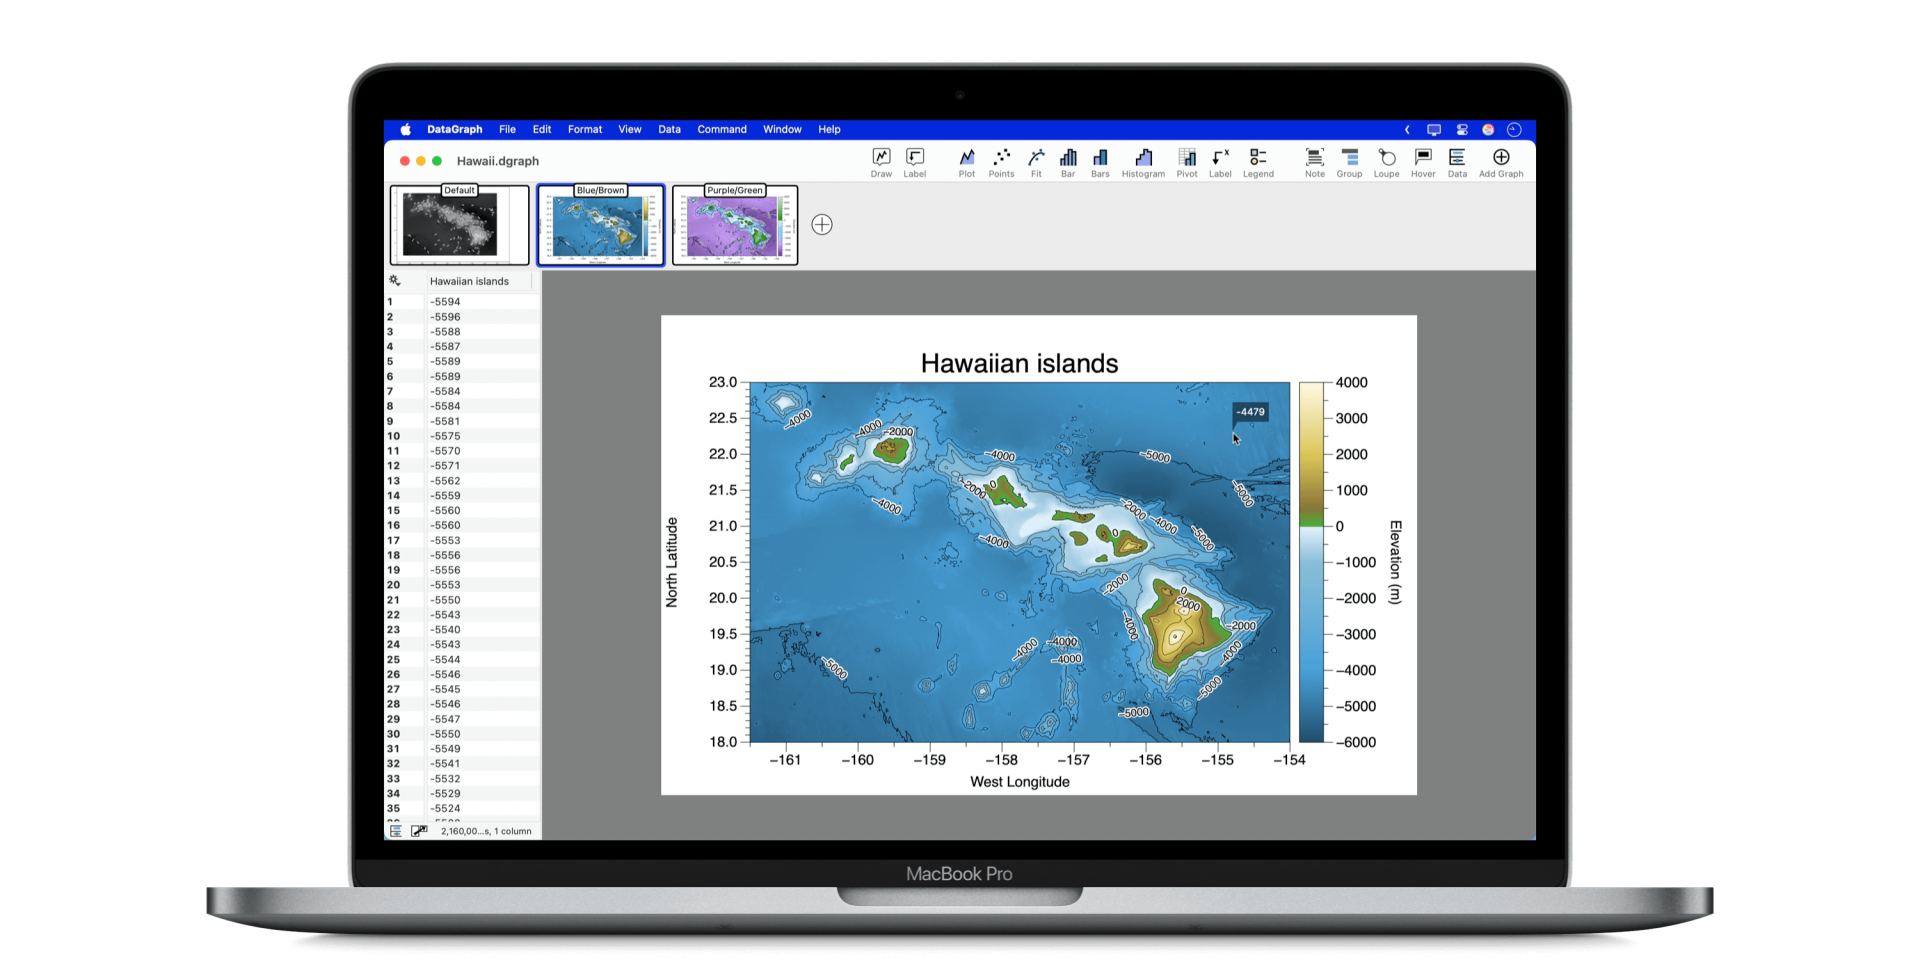
DataGraph 5.5 Released July 11, 2025 🚀!
This is a free update for all DataGraph license holders. Choose your download method based on where you purchased your license:
- Direct License Holders: Download from Visual Data Tools
- Mac App Store Users: Download from the Mac App Store
For technical support or questions about this update, contact us at help@visualdatatools.com or visit our community forums.
DataGraph version 5.5 brings major improvements to scalar field visualization. You’ll find easier contour plotting, more labeling options, and better aspect ratio control.
More Scalar Field Capabilities
The Scalar Field command has received enhancements to significantly improve contour plotting and visualization for heat maps and scalar fields. Here is a view of the Scalar field command showing where you can find these new features.
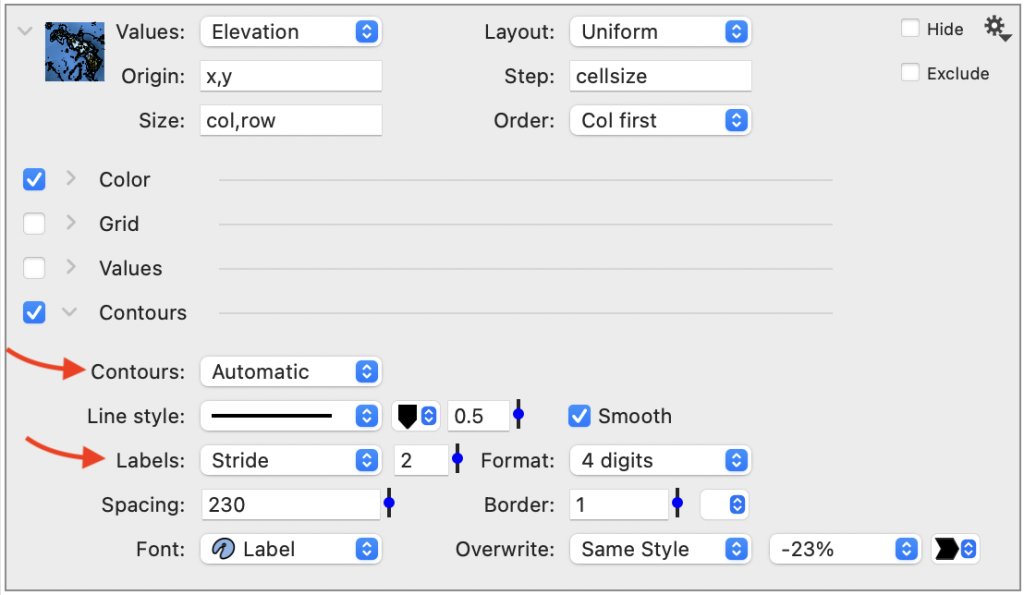
- Automatic Contour Selection – New “Automatic” action intelligently selects optimal contour values based on your data range, eliminating guesswork
- Stride Option for Contours – Added control over contour value spacing, allowing you to customize the density and distribution of contour lines
- Improved Label Spacing – Contour labels now maintain appropriate spacing automatically, preventing overcrowding when contours are tightly packed
More Control Over the Aspect Ratio
The aspect ratio functionality has been completely redesigned, making it possible to remove all the padding around graphic or zoom in and out of images with a set aspect ratio.
This is useful for graphics where you want the padding to be ‘None’ (distance between the axis box and the graphic). The Aspect ratio is set in the Axis settings along with the Padding options.
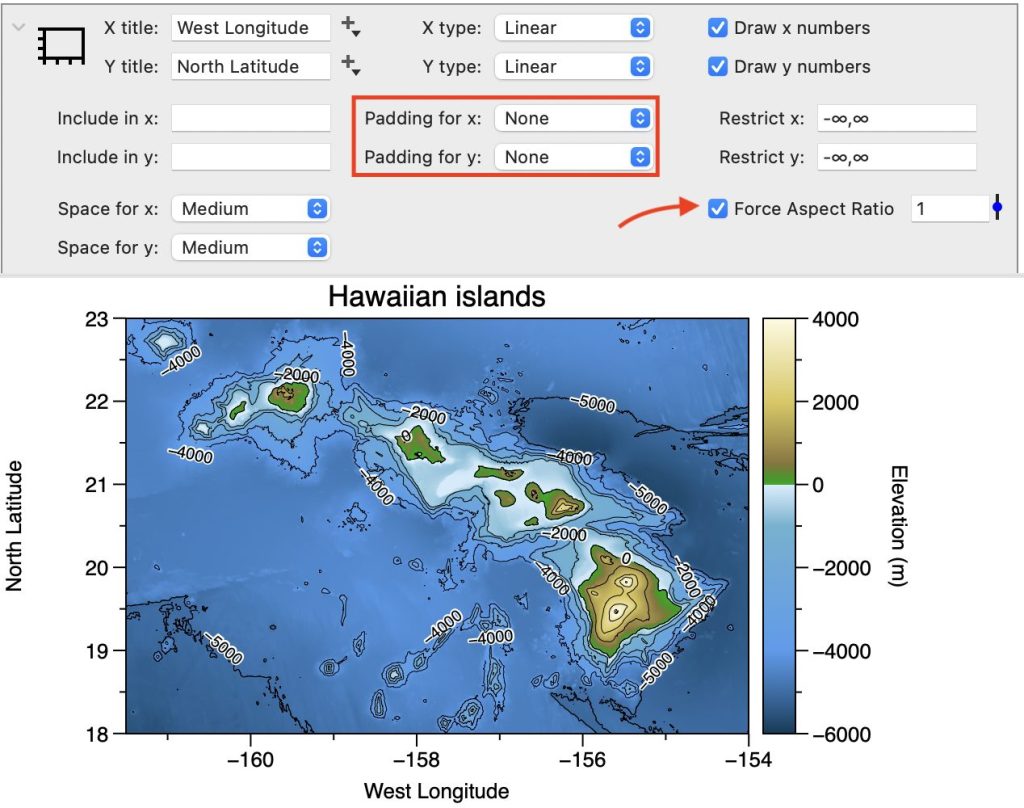
- The ‘Nice’ option for both X and Y axes works as before for standard use cases
- When not using the nice option, the axis region now automatically adjusts to enforce your specified aspect ratio
- Support for fixed aspect ratios when zooming in and out of the graph
Note: When you have the Size set to ‘Automatic’ on the Canvas settings, the graph will add padding to the top or right margin to maintain the aspect ratio. For consistent margins, you may need to specify the size.

Command Improvements
Bars command – Added drag-and-drop functionality for column headings directly to the Bars command, making it easier to add columns to your bar charts with a simple mouse action.
Plots Command – New drawing option added to the Plots command for greater customization when drawing multiple offset lines.
LOESS Curve Fitting – The Plot Action column now supports function evaluation from LOESS (Locally Weighted Scatterplot Smoothing) fits.
Convenient Color Updating
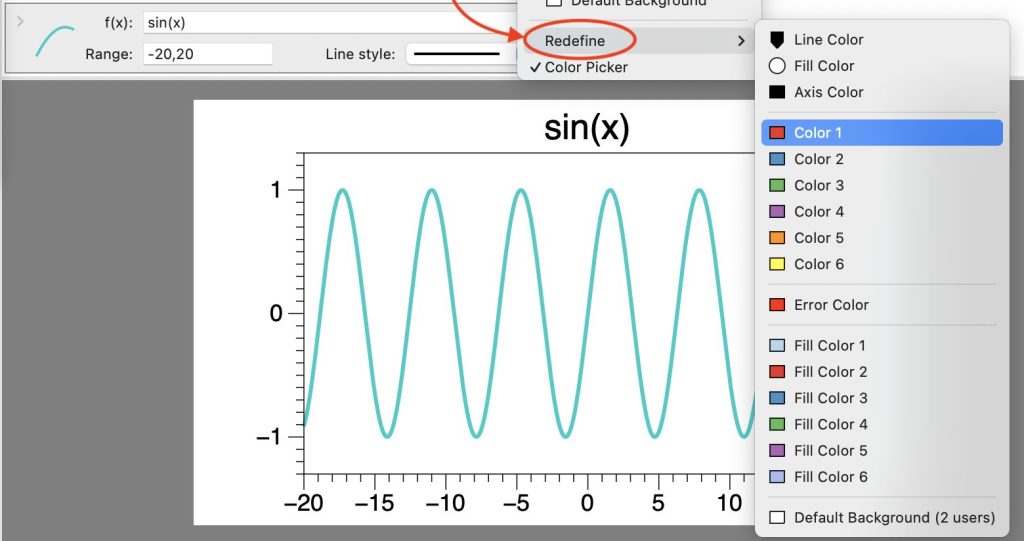
New shortcut to reset the color menu – When you set a custom color using the color picker, a new “Redefine” option will appear the next time you click that color tile, allowing you to assign it to the color menu.
System Compatibility and Performance
Updated macOS Requirements – For Mac App Store users, DataGraph 5.5 requires macOS Big Sur (11.0 or later). If you’re running a version earlier than macOS 11.0, please contact us at help@visualdatatools.com. For direct license holders, DataGraph from our downloads page will work back to macOS 10.9.
Data Handling Improvements
- Fixed an issue where confidence intervals were not calculating with large datasets
- Fixed an issue import data with a the dollar sign ($)
- Fixed issues pasting data from external applications (i.e., MATLAB users)
Leave a Reply
You must be logged in to post a comment.