
In this webinar, we illustrate techniques for exploring data in DataGraph. Learn how to mine data using pivoting, sorting, and filtering. We use a dataset on Nobel prize winners as a use case. The dataset contains over 100 years of data on prize winners along with attributes such as gender and country.
Quick Graph
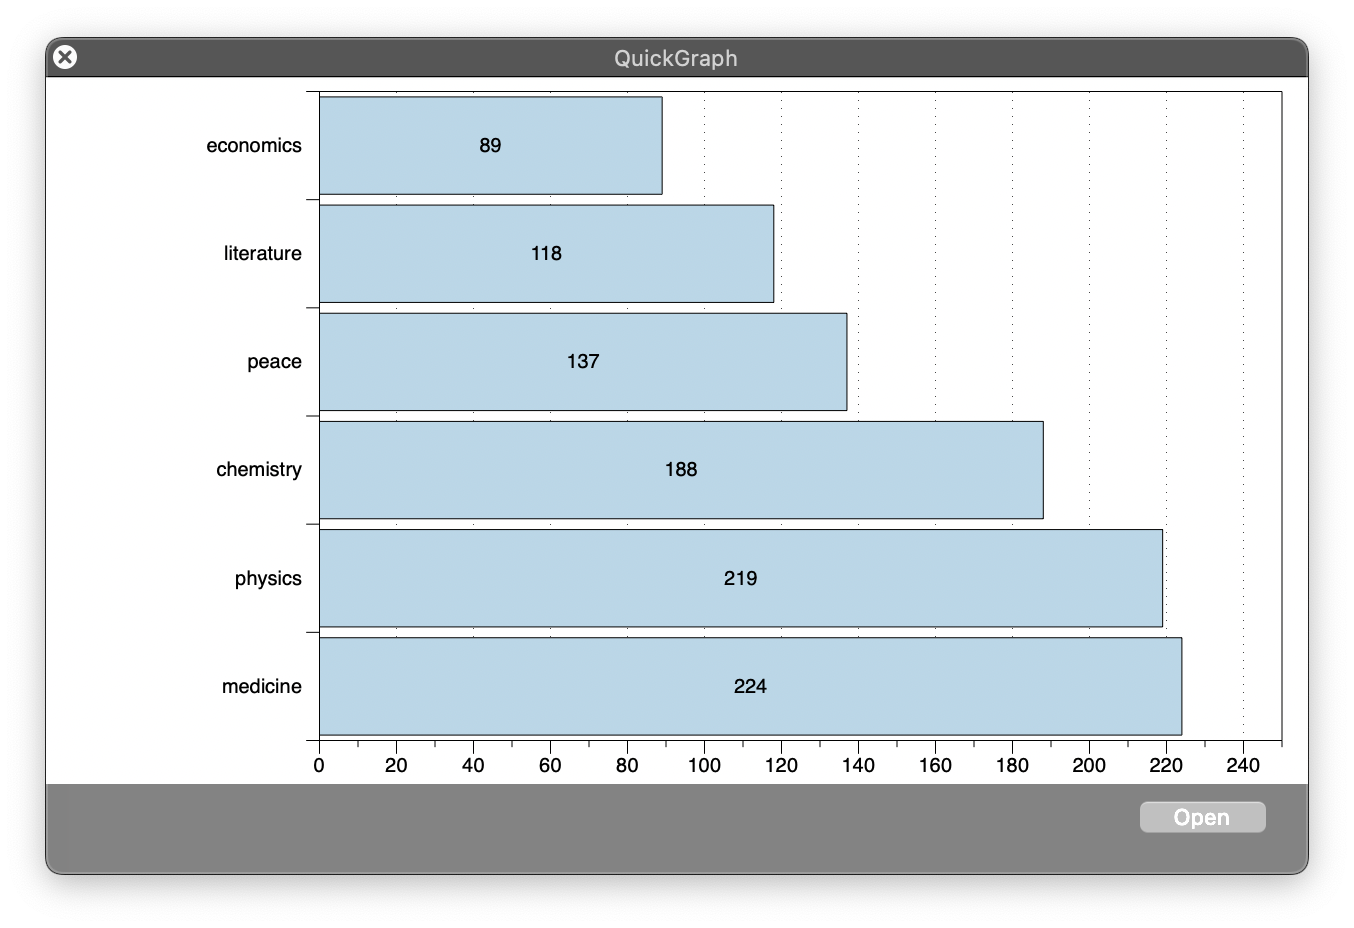
If you’re short on time, there is one section that is a must watch – Quick Graph (YouTube Link – 03:02). In this webinar, QuickGraph is used for exploring columns of text data. All you do it click the header of a column to select the data. Then hit the space bar. Voila!
Examples
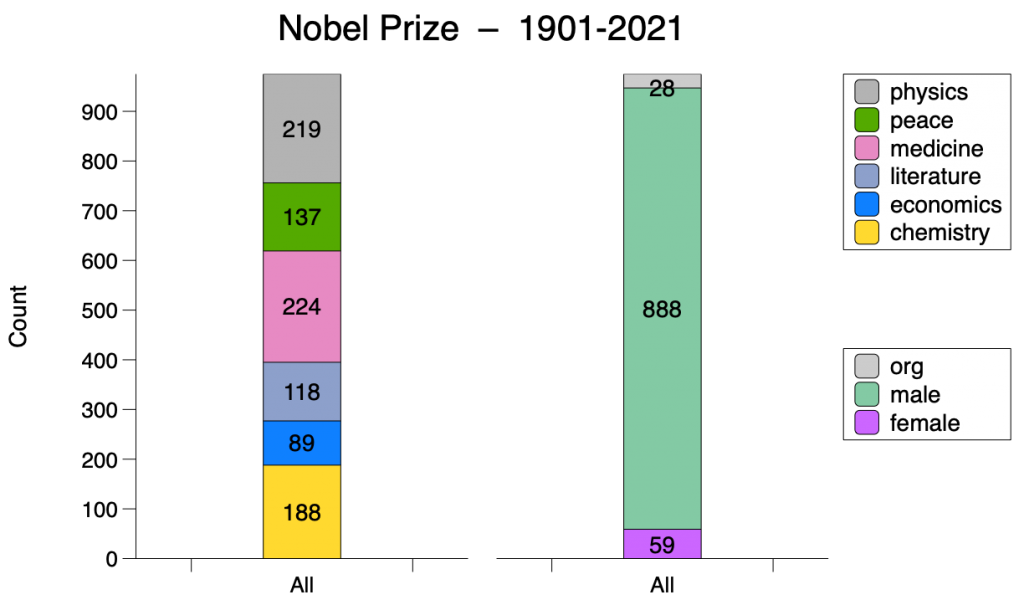
The data and graphs used in the webinar are available in DataGraph using File > On-line Examples. The file contains several graphs created using the Pivot command, such as the one shown here.
Webinar
Watch the full webinar, below or on YouTube.
The following links will open the video in YouTube.
- 00:00 – Introduction
- 00:32 – Where to get the Data
- 03:02 – Quick Graph
- 09:22 – Filter using Command-F
- 15:11 – Graphing/Setting up a Color Scheme
- 18:32 – Stacked Bar Graphs
- 23:47 – Time Series Graphs
- 26:47 – Demo of Zoom/Hover/Select
- 28:41 – Remaining Graphs
- 33:02 – Q&A: How to make a heat map?
- 39:55 – Q&A: Using SQL?
Leave a Reply
You must be logged in to post a comment.