
In this webinar, we examine data on the emergence of electric cars.
- 0:00 Introduction
- 2:43 Overview of Datasets
- 10:36 U.S. Alternative fuel vehicle inventory data
- 26:33 Electric vehicles in Europe
- 32:56 Q&A – How to change from linear to logarithmic?
- 37:35 Q&A – How to reverse X axis for the Pyramid chart?
- 48:23 Next Time
During the course of the webinar, the Bars command is used to create stacked bars, grouped bars, and a pyramid graph.
Alternative fuel vehicle inventory
The first dataset we examine is from the Clean Cities alternative fuel vehicle inventory. This data looks at broad categories of alternative fuel vehicles including plug-in electric vehicles (PEVs).
The data is presented on the Alternative fuels data center website using a stacked bar graph, similar to the one shown here created in DataGraph.

Stacked bar graphs are widely used for this type of data but have the drawback of obscuring the trends for individual categories.
We explore an alternate way to present the same data using a grouped bar graph. In this case, the groups on the X axis are the vehicle category. This allows you to see the trends within individual categories in a much clearer way than the stacked bar graph.
For example, in the graph below, you can see very clearly how the increase in plug-in electric vehicles is much steeper than the other categories.

Electric vehicles in Europe
The next data to set we delved into compares new registrations of electric vehicles across Europe.
This data is presented by European Environment Information and Observation Network (Eionet) using a side-by-side bar stacked graph (shown below). The data on the left is the percentage of passenger cars registered and the data on the right is the number of passenger cars registered by country for 2020.
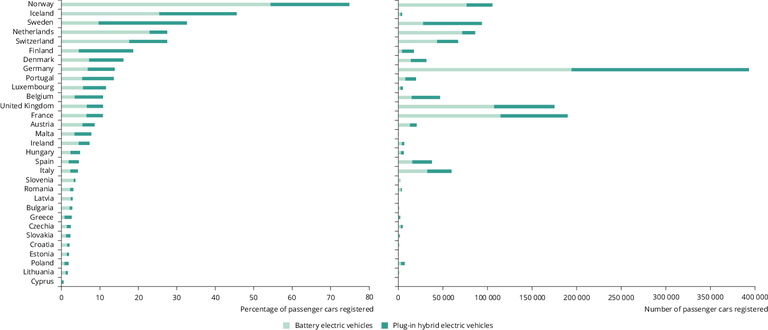
Visually tracking the country data from the left side to the right is difficult in the above graph.
We present an alternative approach using a reverse pyramid graph. In this approach, the bar graph on the left is reversed, making it easier to examine the data for a country across both types of data.

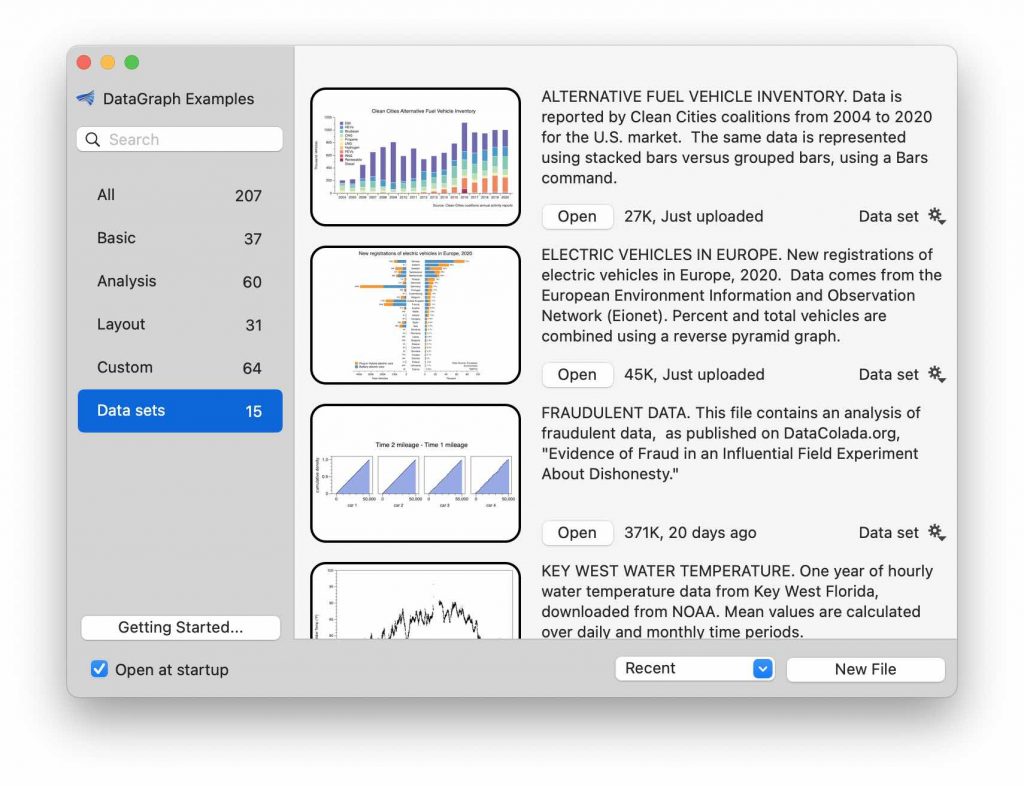
Example Files
You can download the DataGraph files used to construct these diagrams from within DataGraph. Go to File > On-line examples.
The files are in the Data sets section.
Data Sources
Wikipedia: https://en.wikipedia.org/wiki/Electric_car_use_by_country
Alternative fuels data center: https://afdc.energy.gov/data/
European environment agency: https://www.eea.europa.eu/ims/new-registrations-of-electric-vehicles
Leave a Reply
You must be logged in to post a comment.