Our latest version is out and ready to use with Catalina! A major theme in DataGraph 4.5 is improved user support and online documentation.
Dark Mode Support is Here!
DataGraph in Dark Mode causes your graphs to POP! Icons have been updated throughout the program to work in Dark Mode.
A tremendous effort went into creating Dark Mode compatible icons, but we think it was completely worth it. We love using DataGraph in Dark Mode and hope you do too.
Community Forum
The new community forum is an updated version of our on-line help system that has a new bulletin board and news blog. We have also taken our old template files and replaced this with an on-line file collection.
This is a brand new web site that houses a Knowledge base, Discussion Board, and News blog. We’ve added Help links to the gear menus throughout the program, leading you to the Knowledge base. We are already filling the Knowledge base with animated GIFs and more examples.
The forum and the on-line examples will be living resources that continue to evolve with user feedback.
On-Line Examples
The old template manager has been replaced by the new collection of on-line example files. The files are now in a searchable list, that lives in the cloud.
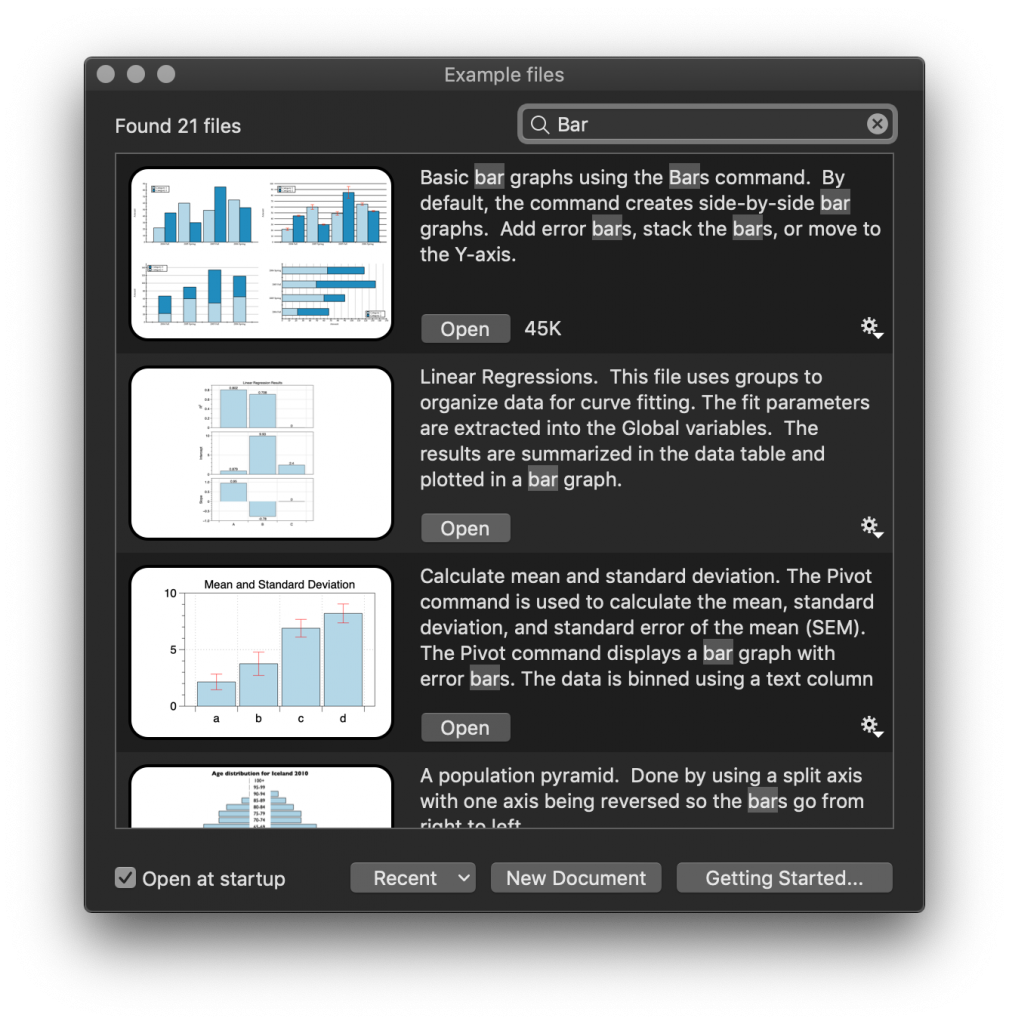
The benefit? Now, when you ask a question or need an example, we can provide a DataGraph file to the on-line collection in real-time.
To access the examples, select File > On-line Examples or type ⇧-⌘-N.
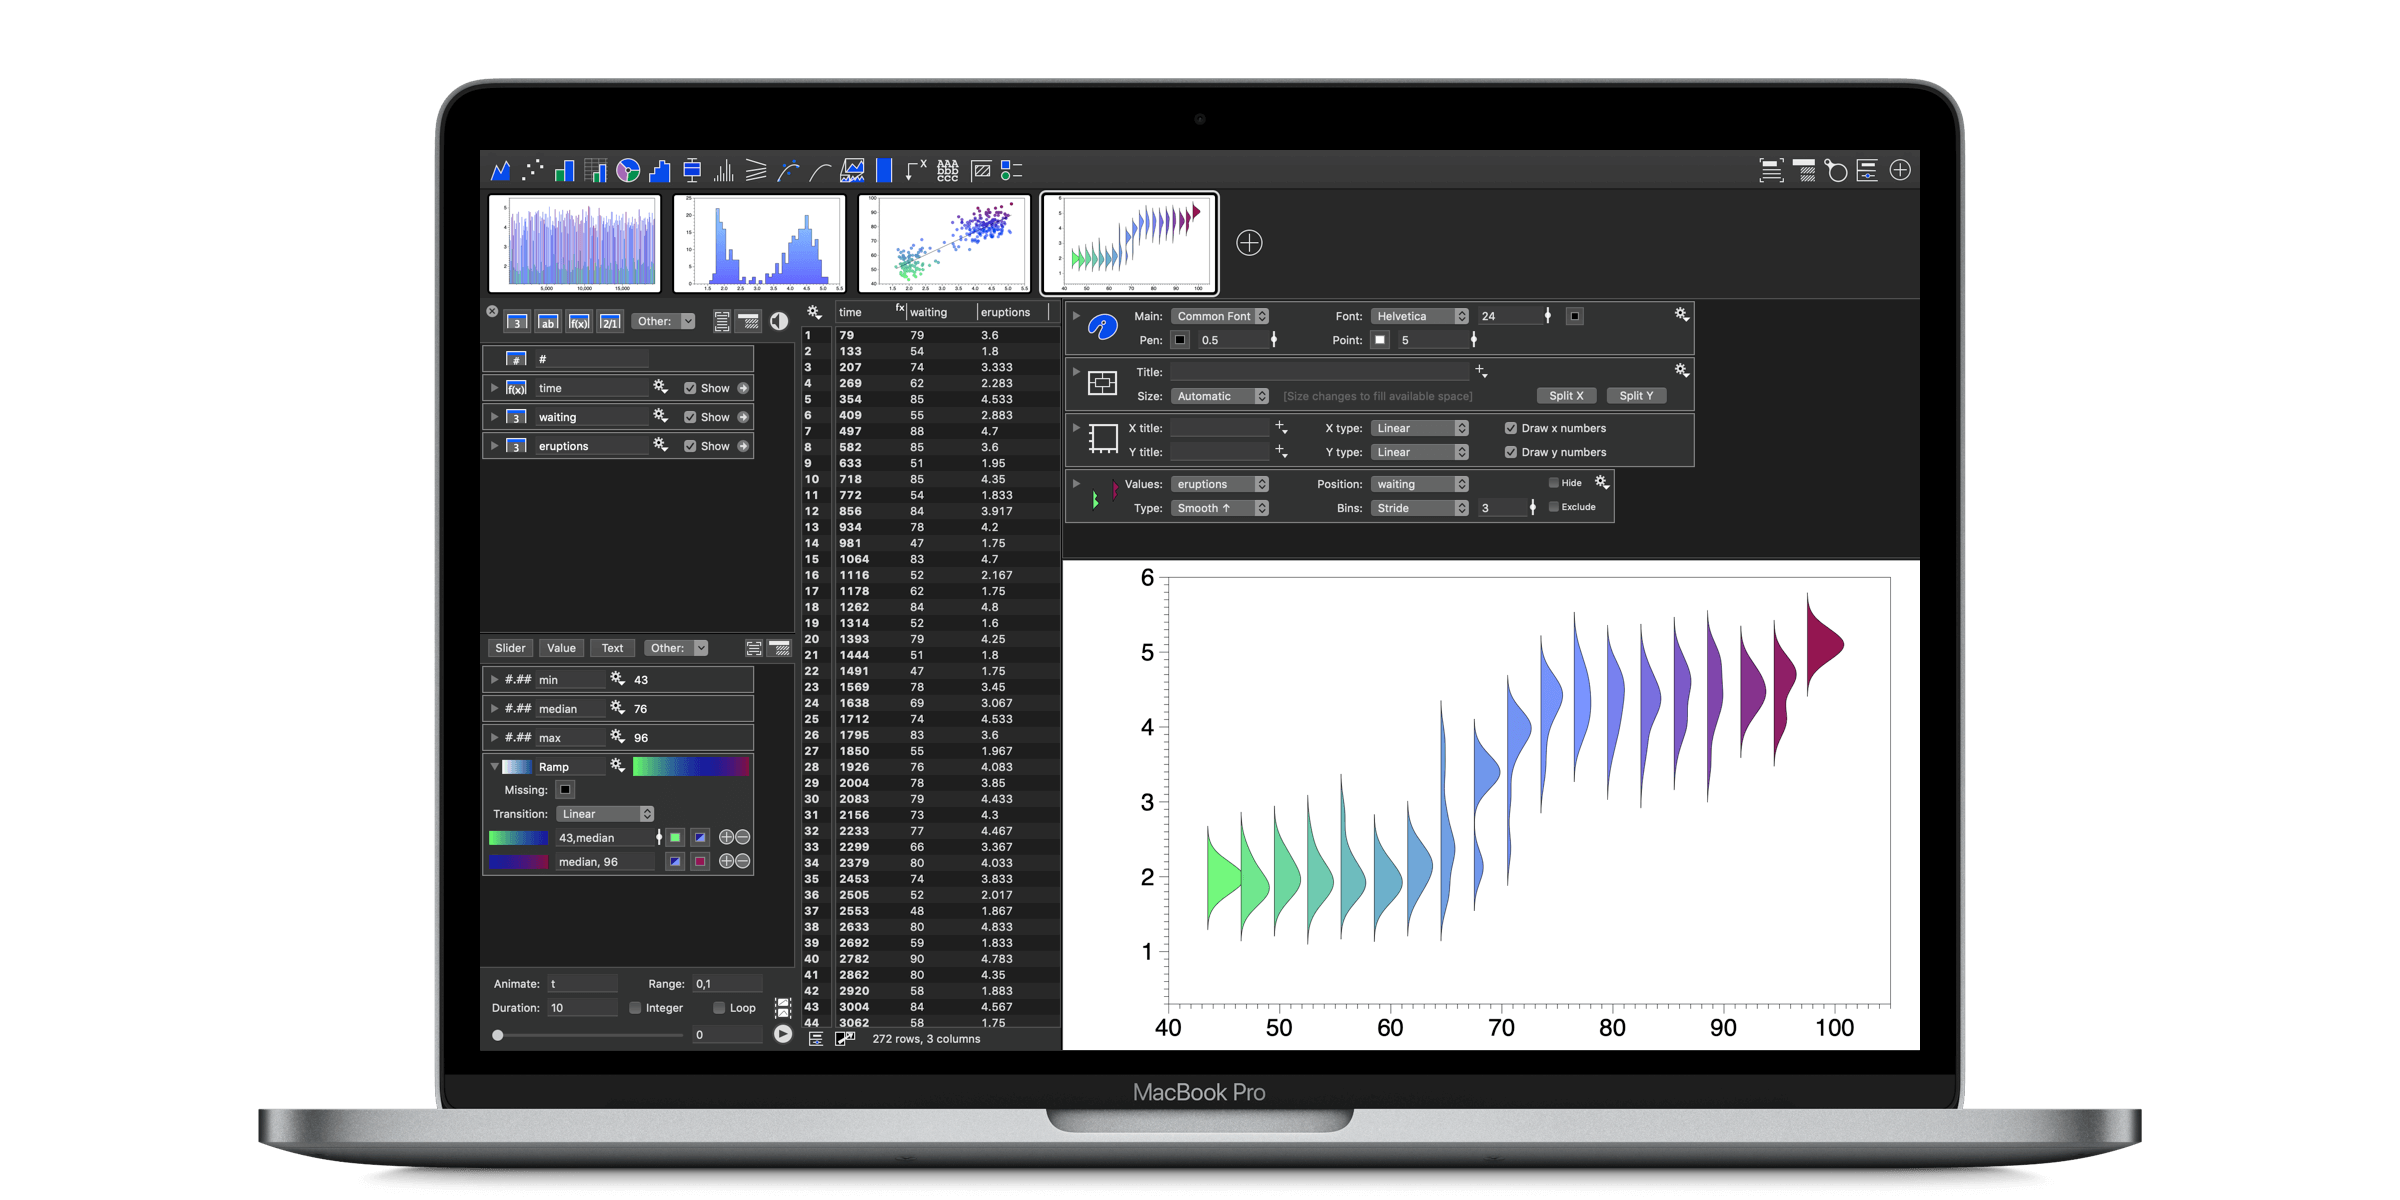
More Powerful Data Table
We have completely rewritten the code underlying the data table. You will now see group names labeled above columns in a group. The column headers can be edited in place and are draggable objects.
Watch a demo of these features when they were still in the beta version, now out in version 4.5.
Other changes are behind the scenes, but table scrolling and calculations are even faster. Easily work with millions of rows of data. Big Data — Bring it on!
Presentation Mode
Give a presentation directly from DataGraph. No need to export images and movies to other presentation tools. Your images and animations will scale to the presentation screen. Control multiple monitors at once. Use DataGraph on your laptop to create a truly interactive presentation.
Learn more: Presentation Mode
More Room for Thumbnails
With the new table mechanism, we decided to change the layout between the thumbnails, and the DataTable; now the thumbnails go all the way across the top of the interface (the thumbnails used to shift to the right when the data definitions was opened).
To make up for some of the lost room in the data dictionary, we decreased the length of the heading between the column list and the list of variables.
Future versions may give you control over the size of the thumbnails. If you like this idea let us know!
Release Notes
To learn more, see the full release notes.