Bars command and category labels
DataGraph Forums › Technical Support › Support Desk › Bars command and category labels
- This topic has 15 replies, 4 voices, and was last updated 7 months, 1 week ago by
ronald parsons.
-
AuthorPosts
-
April 9, 2026 at 4:48 pm #15884
ronald parsons
ParticipantHi,
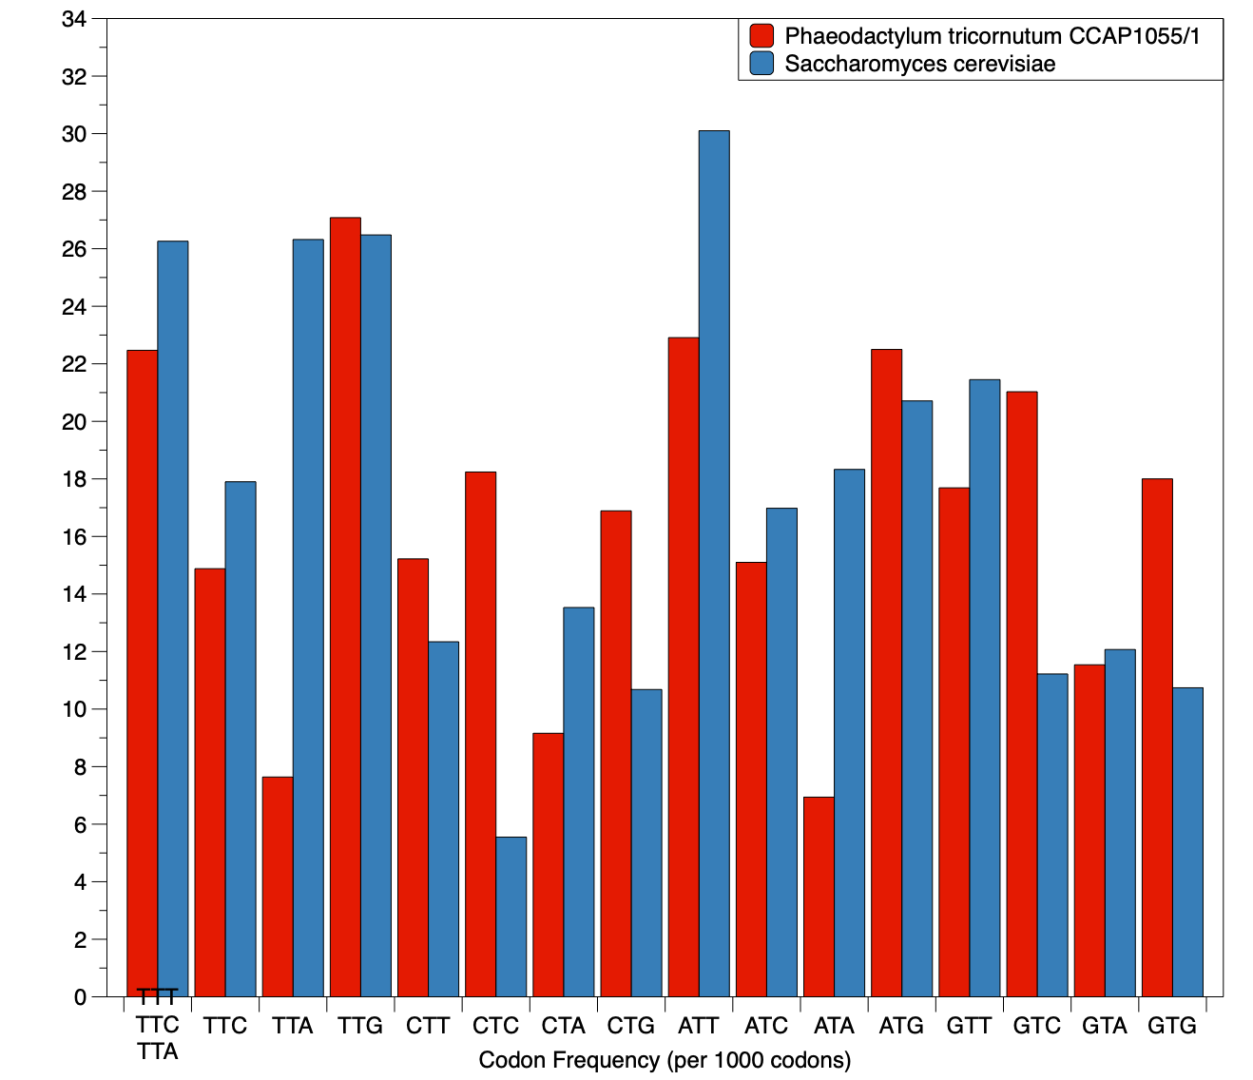
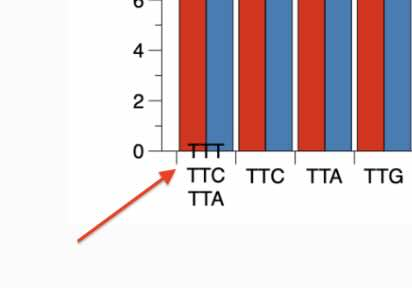
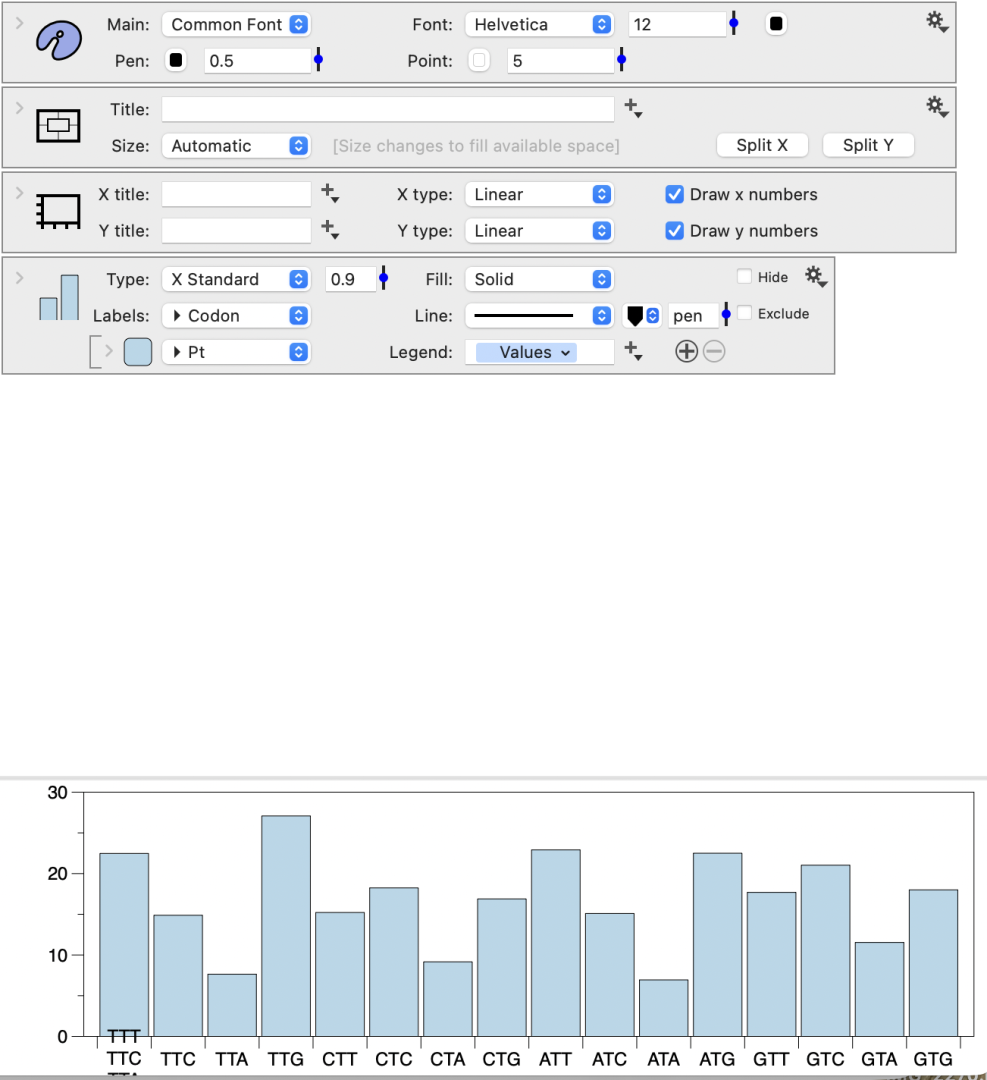
Just made a quick chart using the bars command and the label on the first category is wrong with it somehow grabbing labels from elsewhere in the data and then stacking it together. Example attached. Anyone else see this?
Regards,
Ron
 April 10, 2026 at 4:06 am #15885
Jean-Yves Le Stang
ParticipantHi,
Could be easier to help you having a screen copy of the command settings and the data arrangement but first did you try to enlarge the graph ?
April 10, 2026 at 9:44 am #15886 dgteamModerator
As mentioned — seeing the commands/data would help understand what is happening.
In the corner, it looks like there may be an Extra Axis command or some other command drawing a more refined axis over the main axis. Recommend checking your command list to make sure you only have the one Bars command.
DataGraph will layer the labels like that when there is more than one command and they conflict with one another, in terms of the label at a location.
 April 10, 2026 at 11:11 am #15887Participant
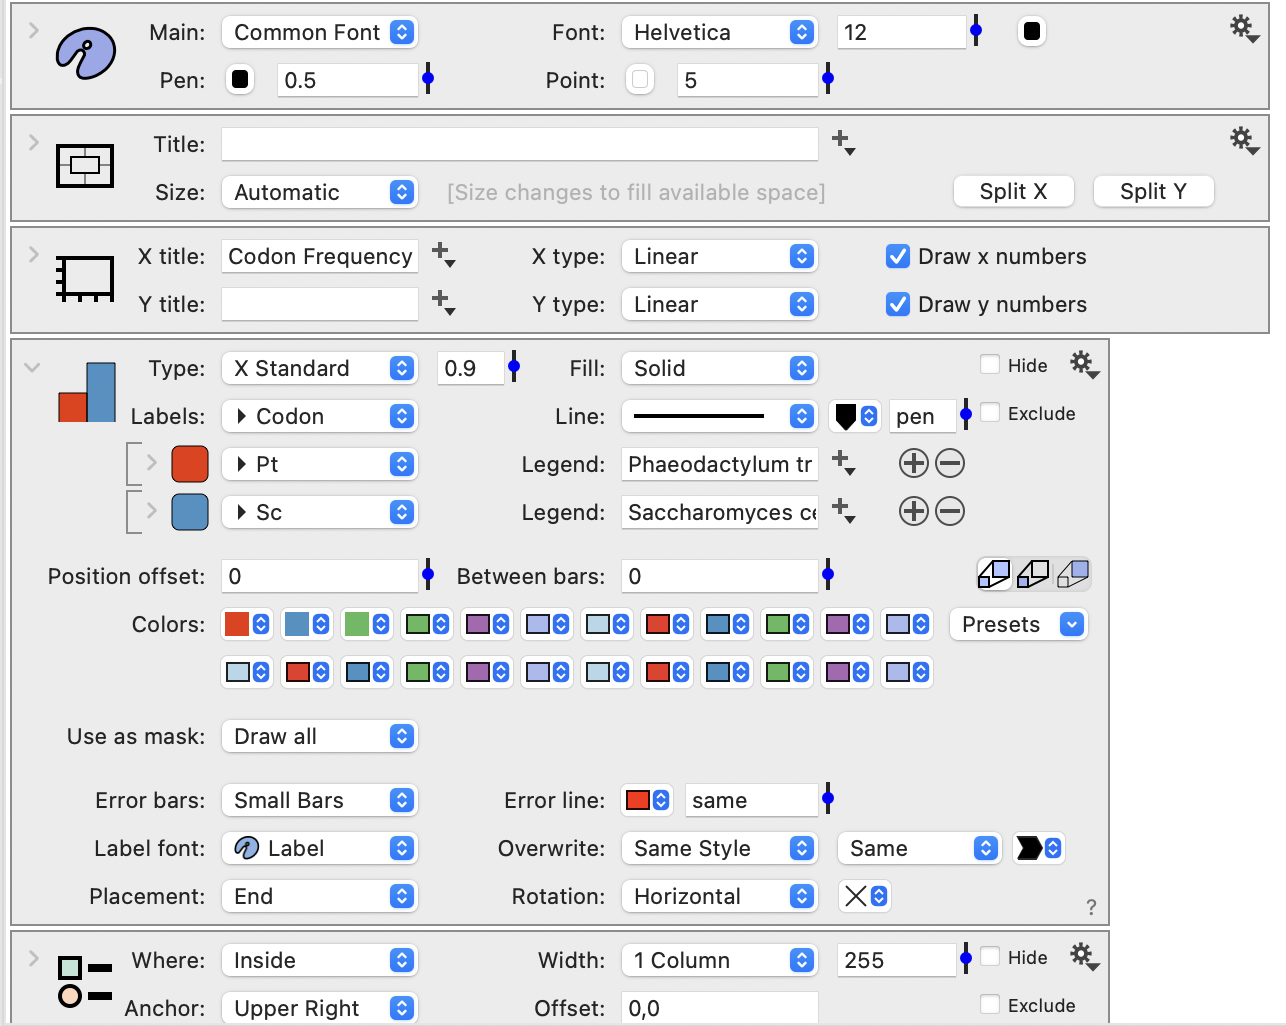
Screenshot of the commands. Data is just in three columns, one for the codon, frequency in Pt and frequency in Sc. I expanded the Bars command, and there isn’t anything else below the legend command.
 April 10, 2026 at 12:04 pm #15888Participant
Hi,
Try setting up the rotation menu to vertical and/or reducing the label font
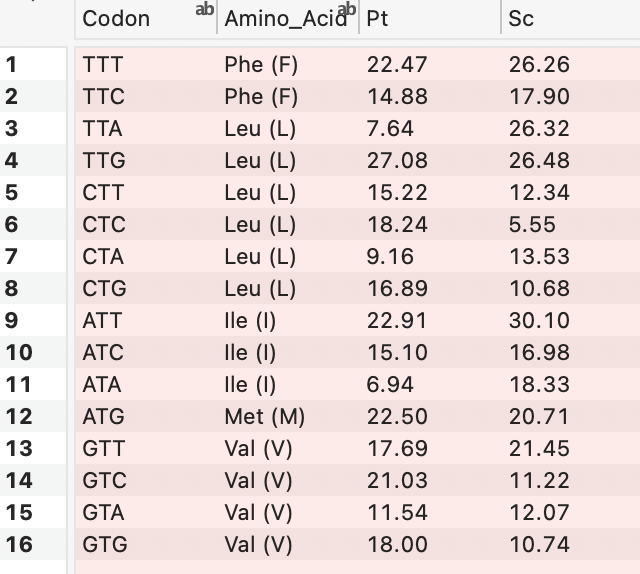
Otherwise, where the “codon labels” come from ? there should be a 4th column for them
Screenshot of all columns would further help
April 10, 2026 at 12:29 pm #15889ParticipantScreenshot of data columns for the graph …
 April 10, 2026 at 12:31 pm #15890Participant
And if I build it from scratch using the above data by selecting the bar command, then adding the codon and the Pt data, I get something similar.
 April 10, 2026 at 4:26 pm #15891Participant
Hi Ronan,
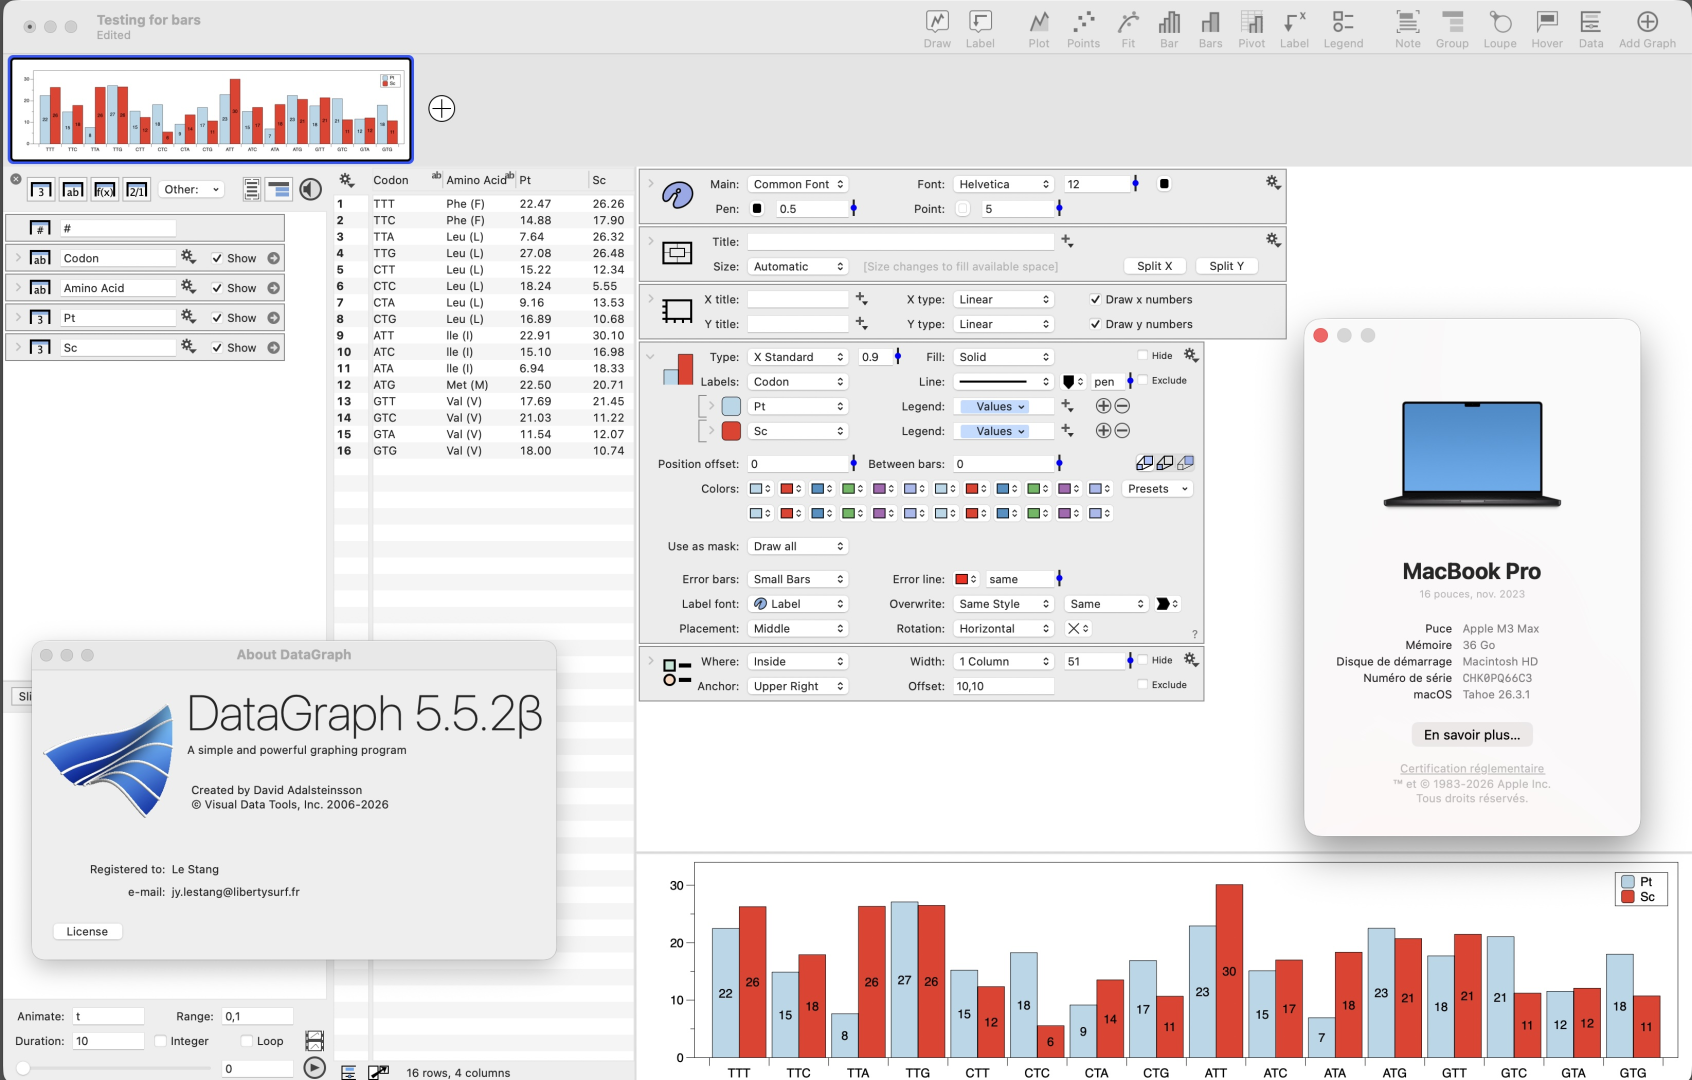
I have copied your data and created a “Bars Command” like yours. I got a good result. I have added the data values as integers in the middle of bars to check consistency and it seems OK.
I use a MacBook Pro with Tahoe 26.3.1 and DG 5.5.2 Beta.
I have tried unsuccessfully several tricks to reproduce your situation. I leave the subject into the hands of DG Team…
You can download my file from this link. https://www.dropbox.com/scl/fi/8a4ff9pteja2o0yo9avf4/Testing-for-bars.dgraphs?rlkey=wviyikmc5rxlenhacmaytd39w&dl=0
I hope it helps
 April 10, 2026 at 5:29 pm #15892Participant
Thanks for doing this. I downloaded your file and it opened fine on my machine so I must have set something without realizing it. I’m running the same beta and OS on my machine, but your file should give me a chance to figure things out.
Appreciate the help!
Ron
April 11, 2026 at 3:51 am #15893ParticipantHappy to help.
I suggest you transmit your file to DG team for examination.
Regards
Jean-Yves
-
AuthorPosts
- You must be logged in to reply to this topic.
DataGraph Forums › Technical Support › Support Desk › Bars command and category labels