Y-standard bars with percent label right of the bar

DataGraph Forums › Technical Support › Support Desk › Y-standard bars with percent label right of the bar

Tagged: 

Viewing 4 posts - 1 through 4 (of 4 total)
  • Author
    Posts
  • #15903
    mphelpsmd
    Participant

      Hi,

      I have a Y-standard bar graph whose values are all percents that should range from 0-100%.  I want the percent to show on the far right of each bar.  I have the labels set to the value (a percent), the format to “#.#”, a single blank space (” “) before each label, and a percent sign (“%”) after each label.

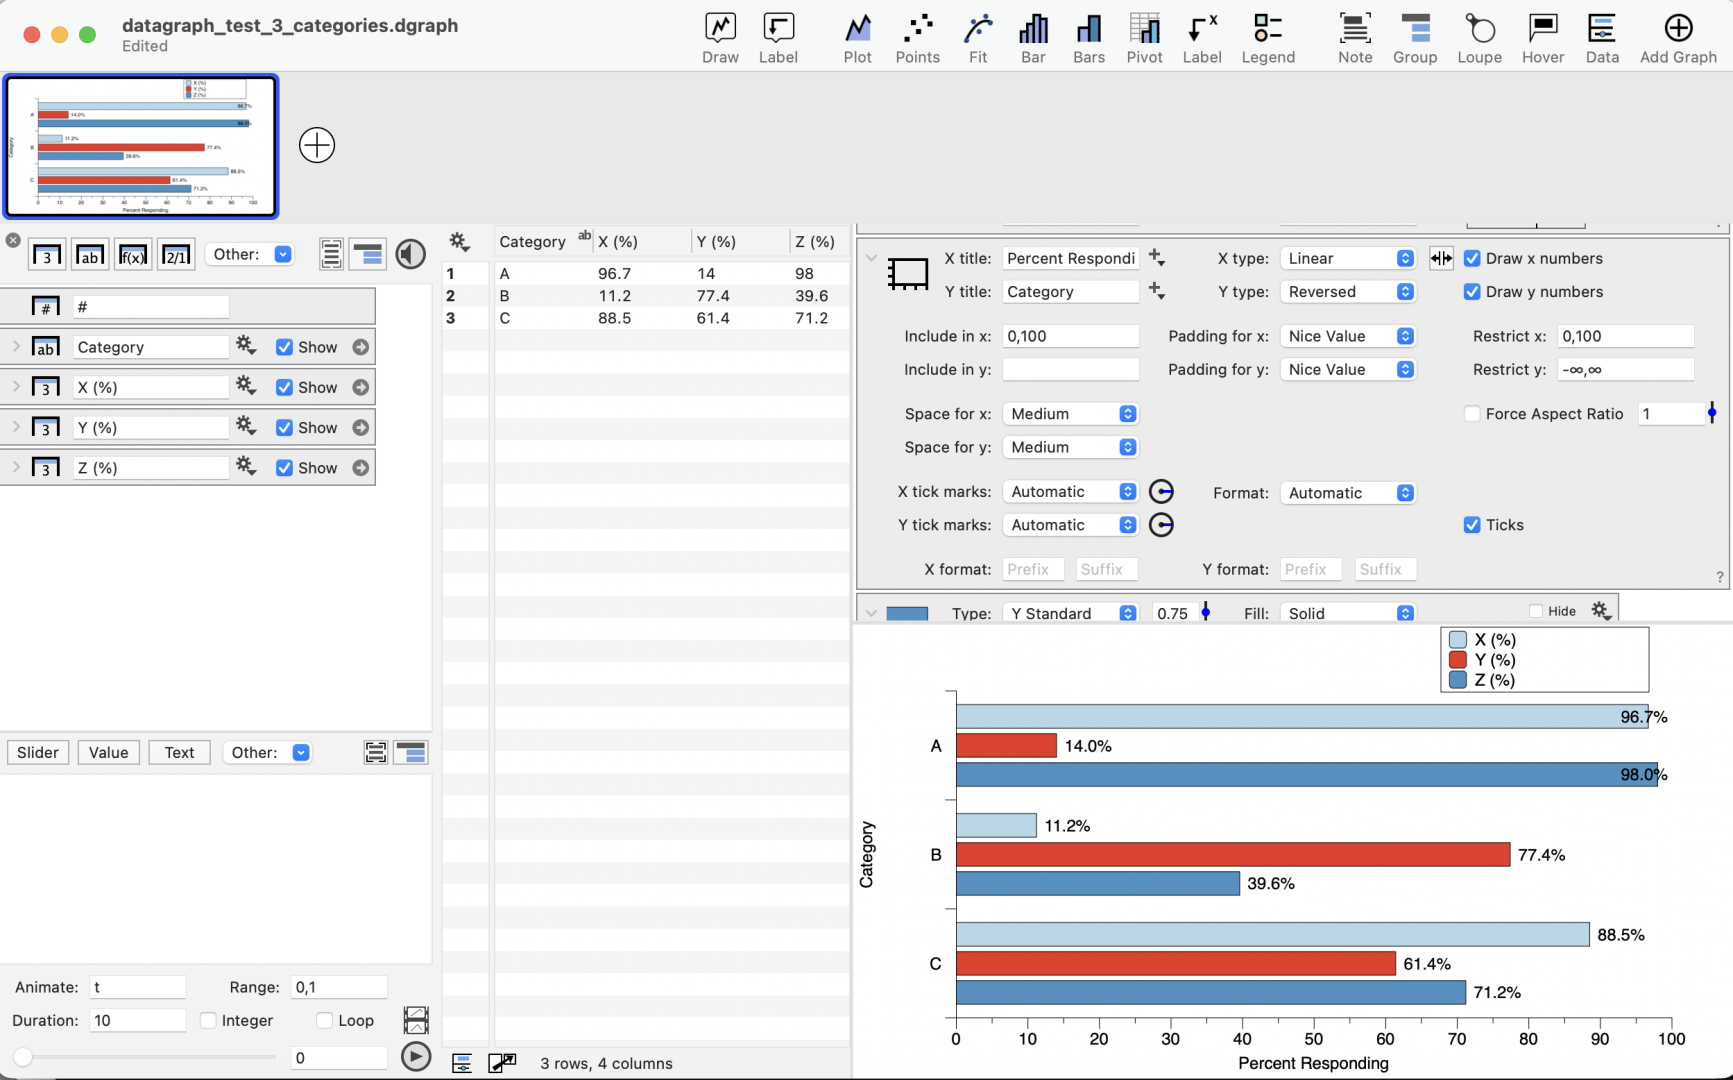
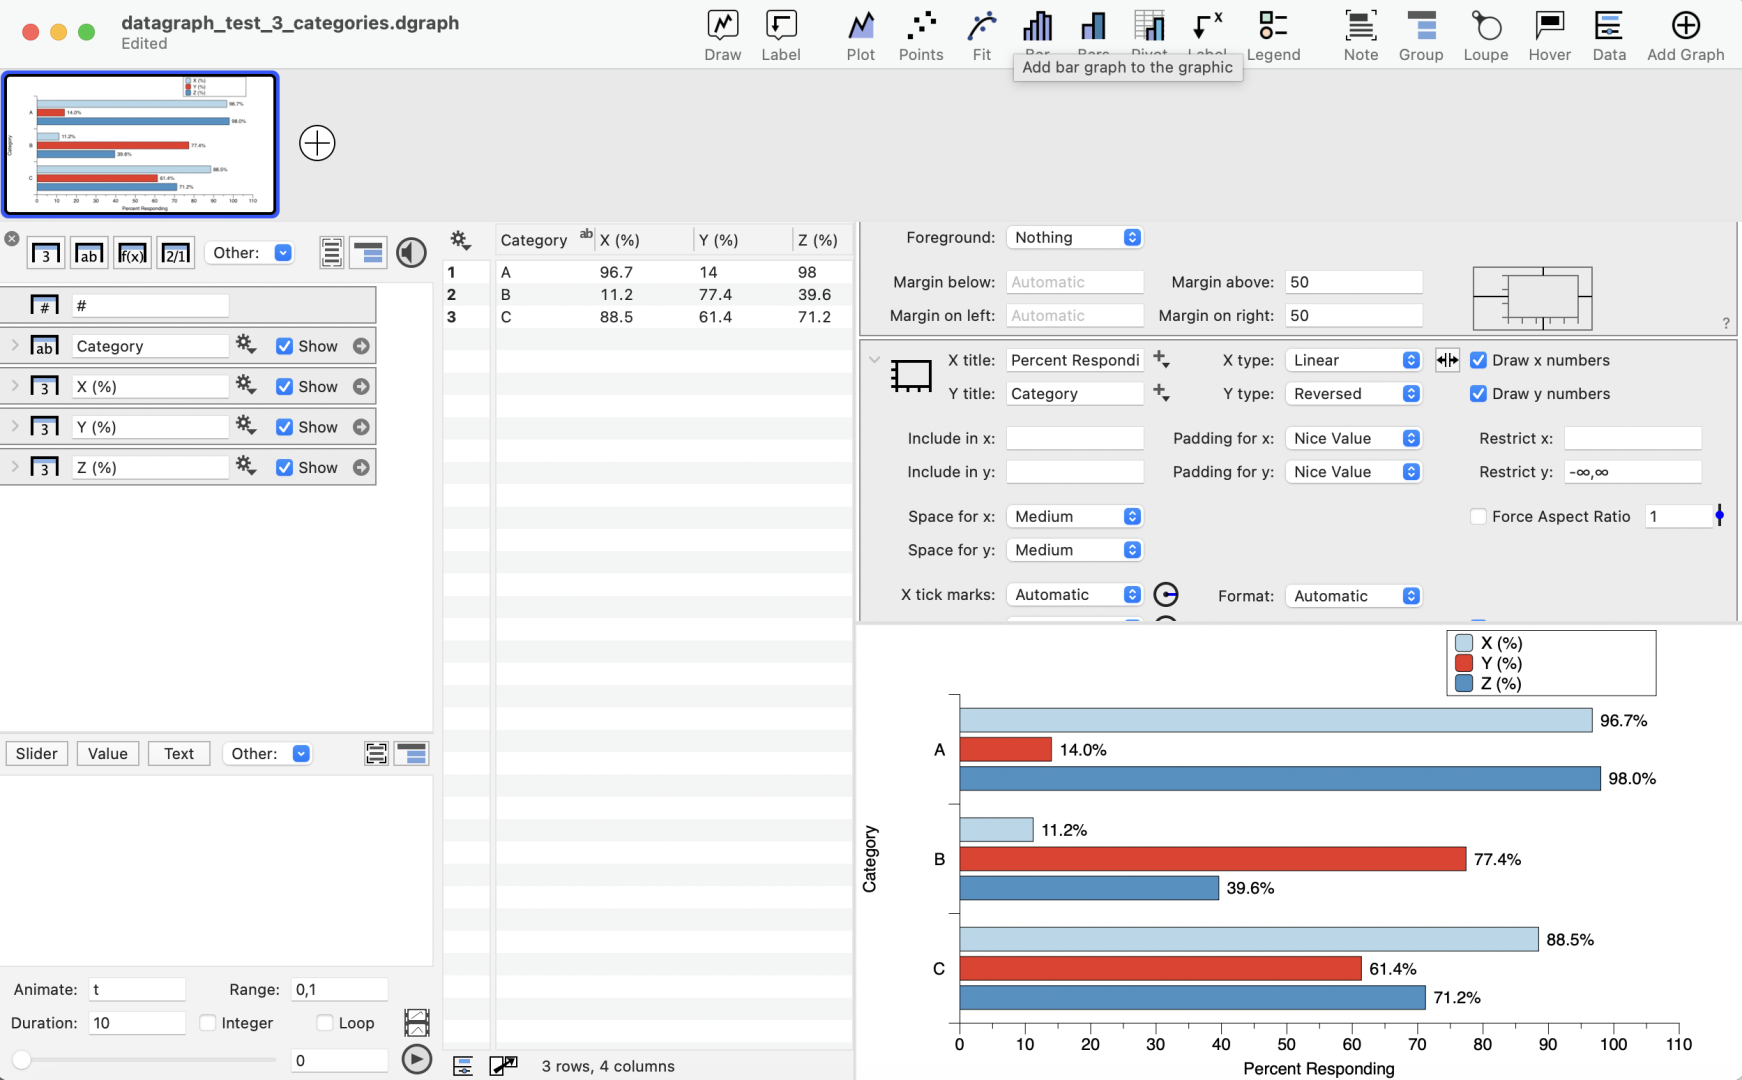
      It looks fine as long as I don’t restrict the x-axis and allow the x-axis to range from 0 to 110.  When I restrict x so that the x-axis is from 0-100, some of the labels with long bars gets embedded in the bar, rather than to the right of it.

      Is there a simple way to restrict the x-axis values from 0 to 100 and have enough margin on the right to allow for the value labels to always be to the right of the bars?

      Thanks,

      Mike


      datagraph_screenshot_percents_at_end_of_barsdatagraph_screenshot_percents_at_end_of_bars_no_x_restrictions

      #15905
      Jean-Yves Le Stang
      Participant

        Hi,

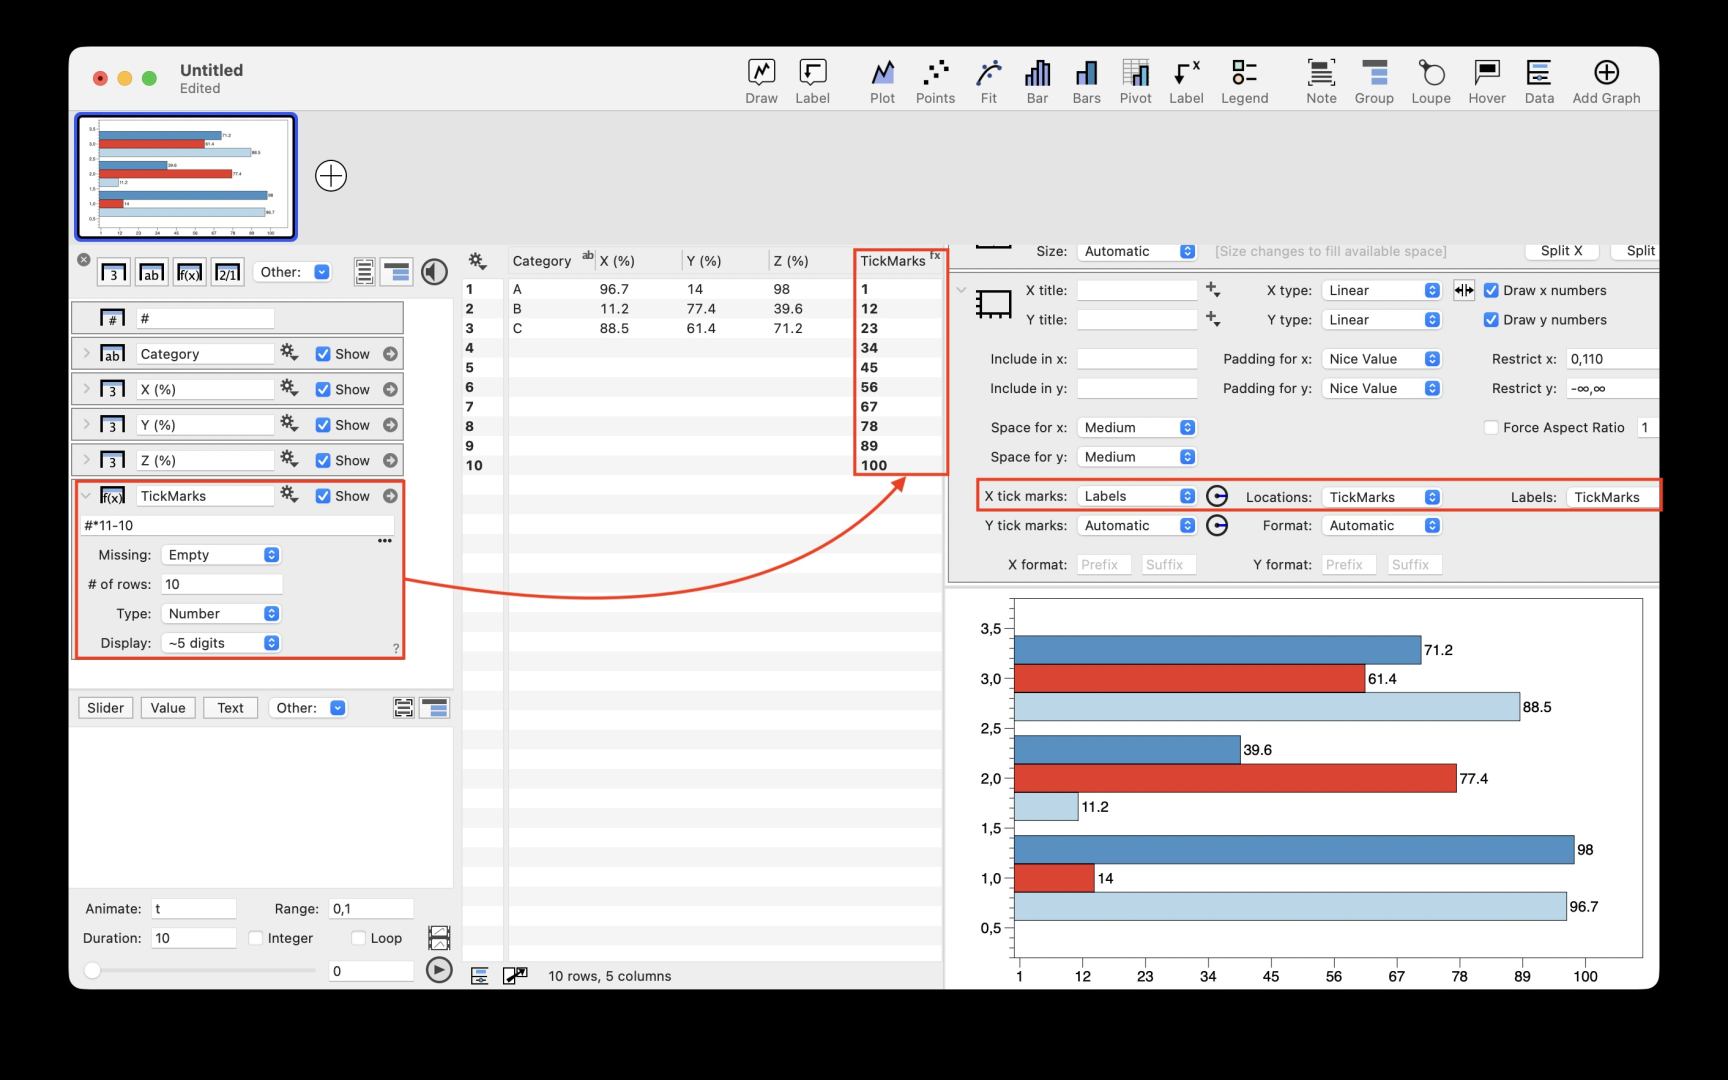
        I suggest you keep the X axis restriction to 110 and limit the X tick marks to 100.

        For this you create a column of value from 0 to 100 and use it in the “X Tick Marks” choice of the Axis Command

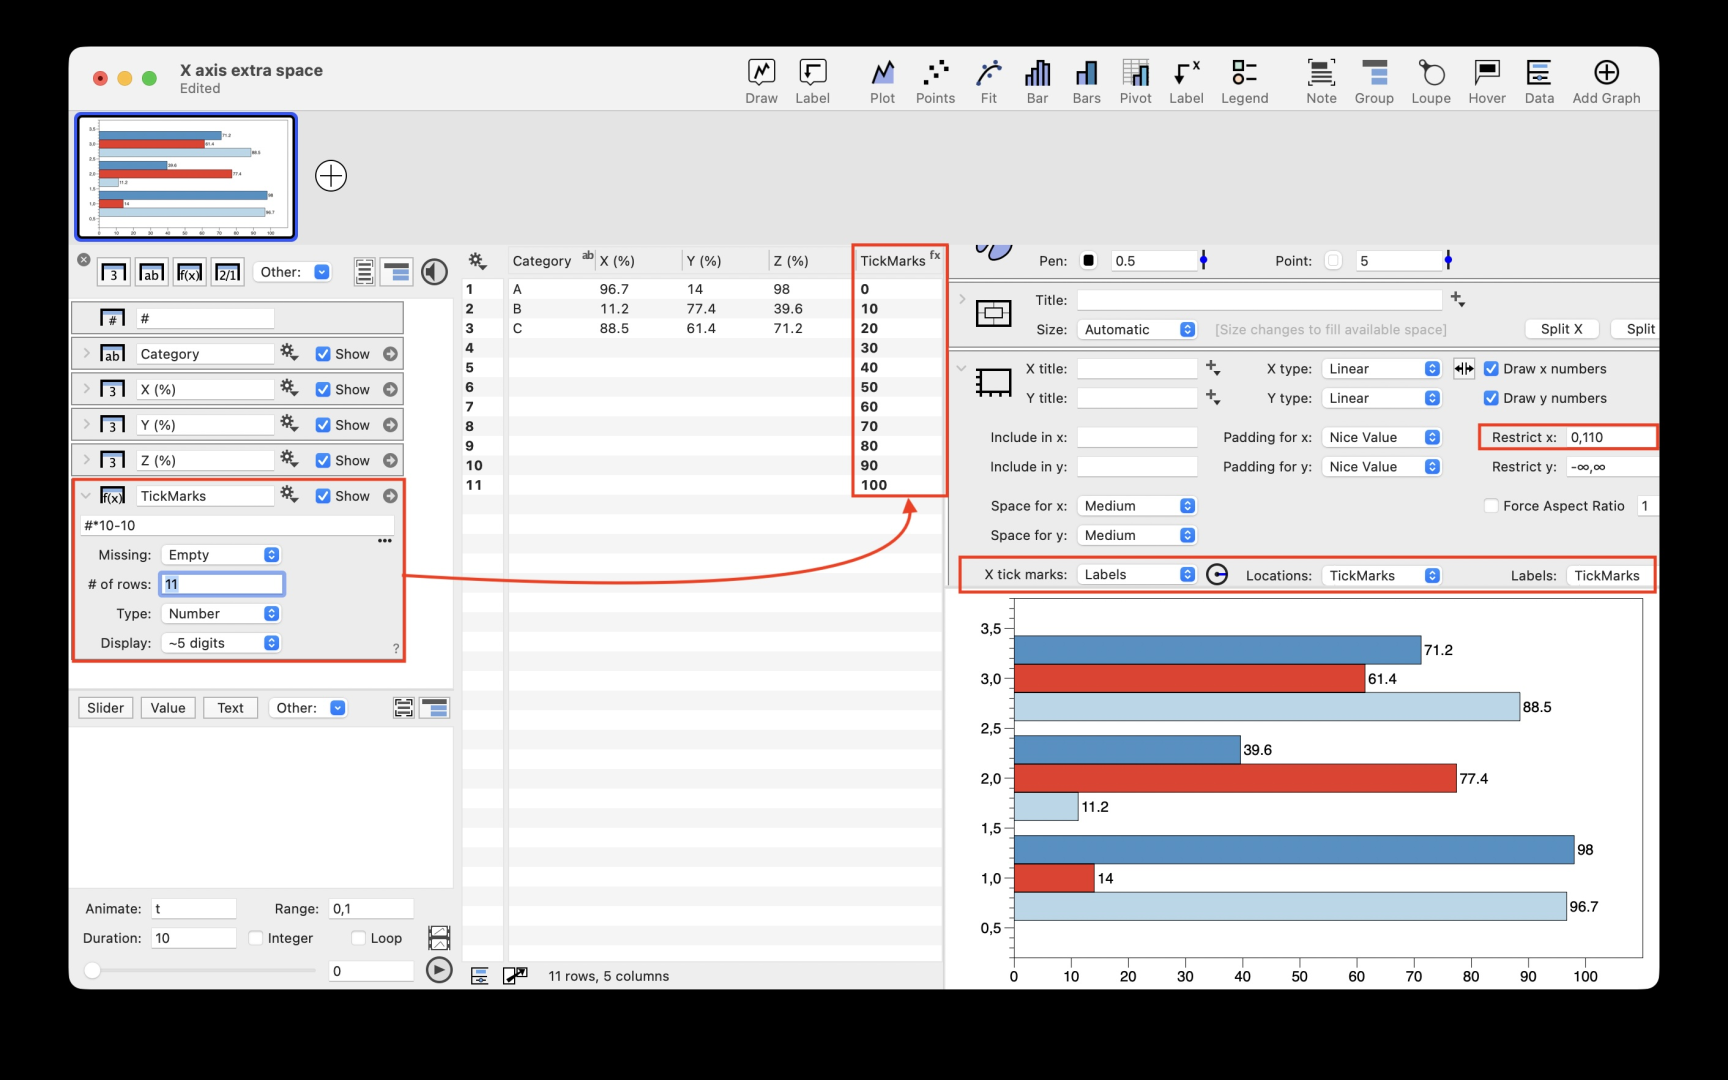
        You can also replace the 110 value by 100+ExtraSpace where ExtraSpace can be controlled by a slider. So you have a better control over the graph layout.

        Not sure it is simple  but I Hope it helps

        Regards

        ScreenCapture

        #15906
        Jean-Yves Le Stang
        Participant

          Sorry for wrong tick marking… here is the good one

          ScreenCapture

          #15907
          dgteam
          Moderator

            You also can try an Extra Axis command, which has a more flexibility to specify when the axis should begin and end.

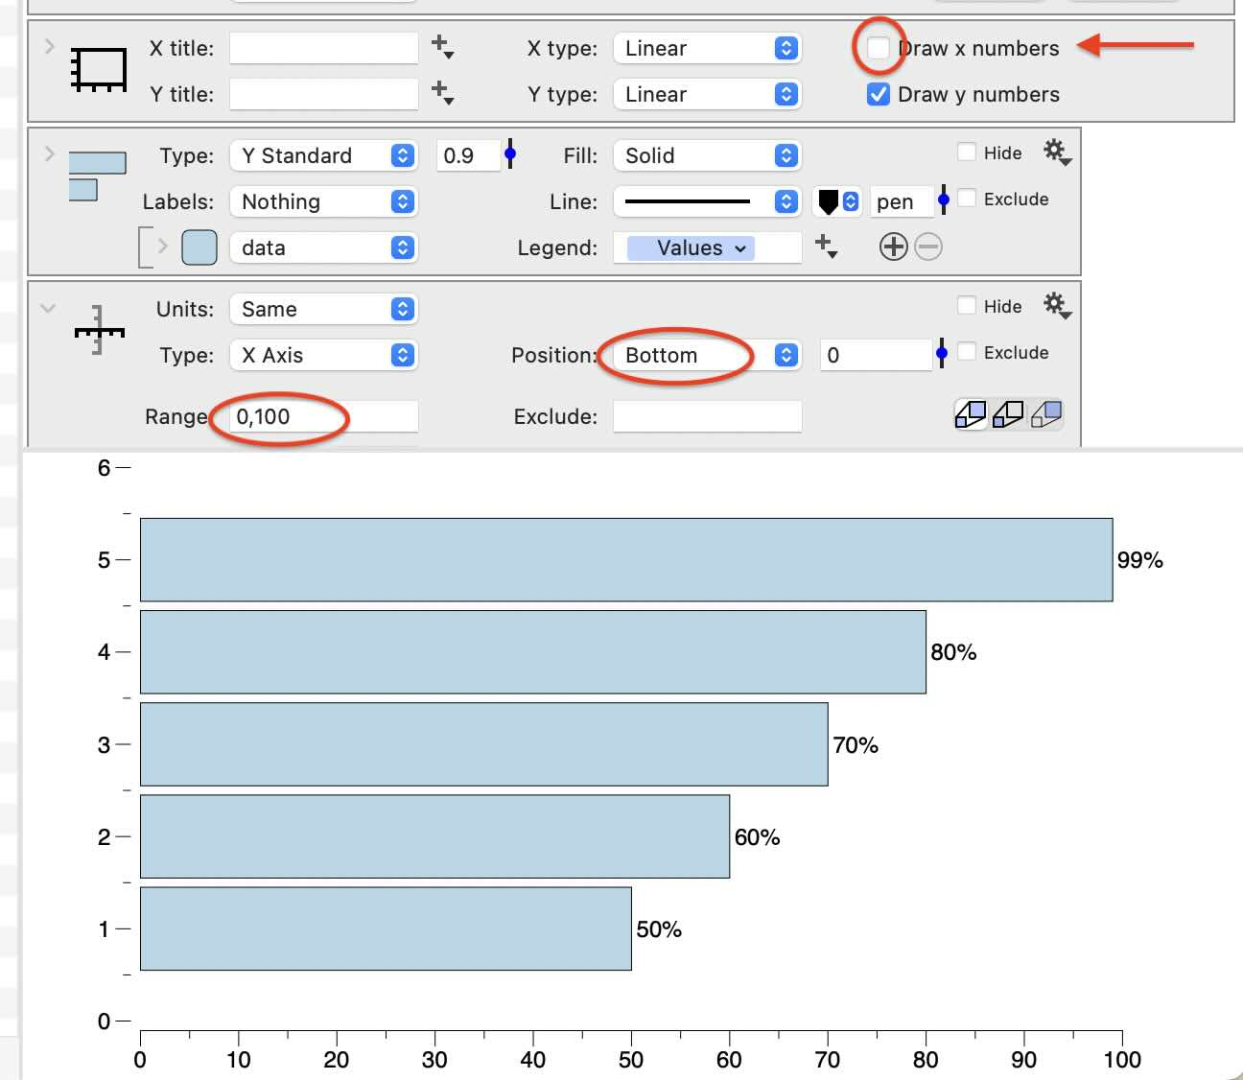
            On the screenshot below, there is no Restriction to the axis but the default axis is removed by unchecking ” Draw x numbers”.

            Click the Label menu in the tool bar, and add the Extra Axis. Use the Range option to specify the beginning and end of the tick marks, here set from 0,100. This does not change the range of data, just the part that is labeled.

            Note the Extra Axis command has the same functionality to specify exact tick mark locations using a column in the table as described above.
            Axis

            For more on controlling the axis range with the Include, Padding, and Restrict options, check out the Axis settings article.

          Viewing 4 posts - 1 through 4 (of 4 total)
          • You must be logged in to reply to this topic.

          DataGraph Forums › Technical Support › Support Desk › Y-standard bars with percent label right of the bar