Stacked bar charts
DataGraph Forums › Technical Support › Support Desk › Stacked bar charts
- This topic has 4 replies, 2 voices, and was last updated 1 year ago by
todd franke.
-
AuthorPosts
-
November 10, 2025 at 1:46 pm #15851
todd franke
ParticipantI want to create one chart with four variables in stacked bars: cg_1_N, cg_2_N, cg_3_N, and cg_4_N. The values are 0-4: 0-Not at all true of me, 1-Slightly true of me, 2-About halfway true of me, 3-Mostly true of me, 4-True of me. I can create one, but when I try to make the second, it simply lies on top of the first. I have been attempting pivot, which produces one (cg_1_N), and tried to create a copy of the first and replace the variable name with cg_2_N, but that does not work. In addition to the percentages of each response in the bar, I like the legend to display the string response, not the number (0-4).
November 12, 2025 at 9:27 am #15852 dgteamModerator
Could you send a screenshot of your user interface? Without seeing the format of your data it is hard to diagnose the issue. For example, whether your data is in a wide or long format will make a difference in the best path.
You can see examples of the wide and long format under this article:
How to flatten dataThere are some demos in this article that also might help showing bar graphs made with either format, where the wide data can be graphed with the Bars command, and the long format data works with the Pivot command.
How to make a Bar GraphIf you prefer, you can email your file to us.
From the DataGraph menu bar: Help > Ask a question via email.November 12, 2025 at 1:32 pm #15855ParticipantID Relationship cg_1_N cg_2_N
1 Mother 2 3
2 Father 1 4
3 Mother 2 1
Total N=216
November 13, 2025 at 12:32 pm #15856dgteamModeratorThanks for sending the format. This is a wide format (variables in different columns).
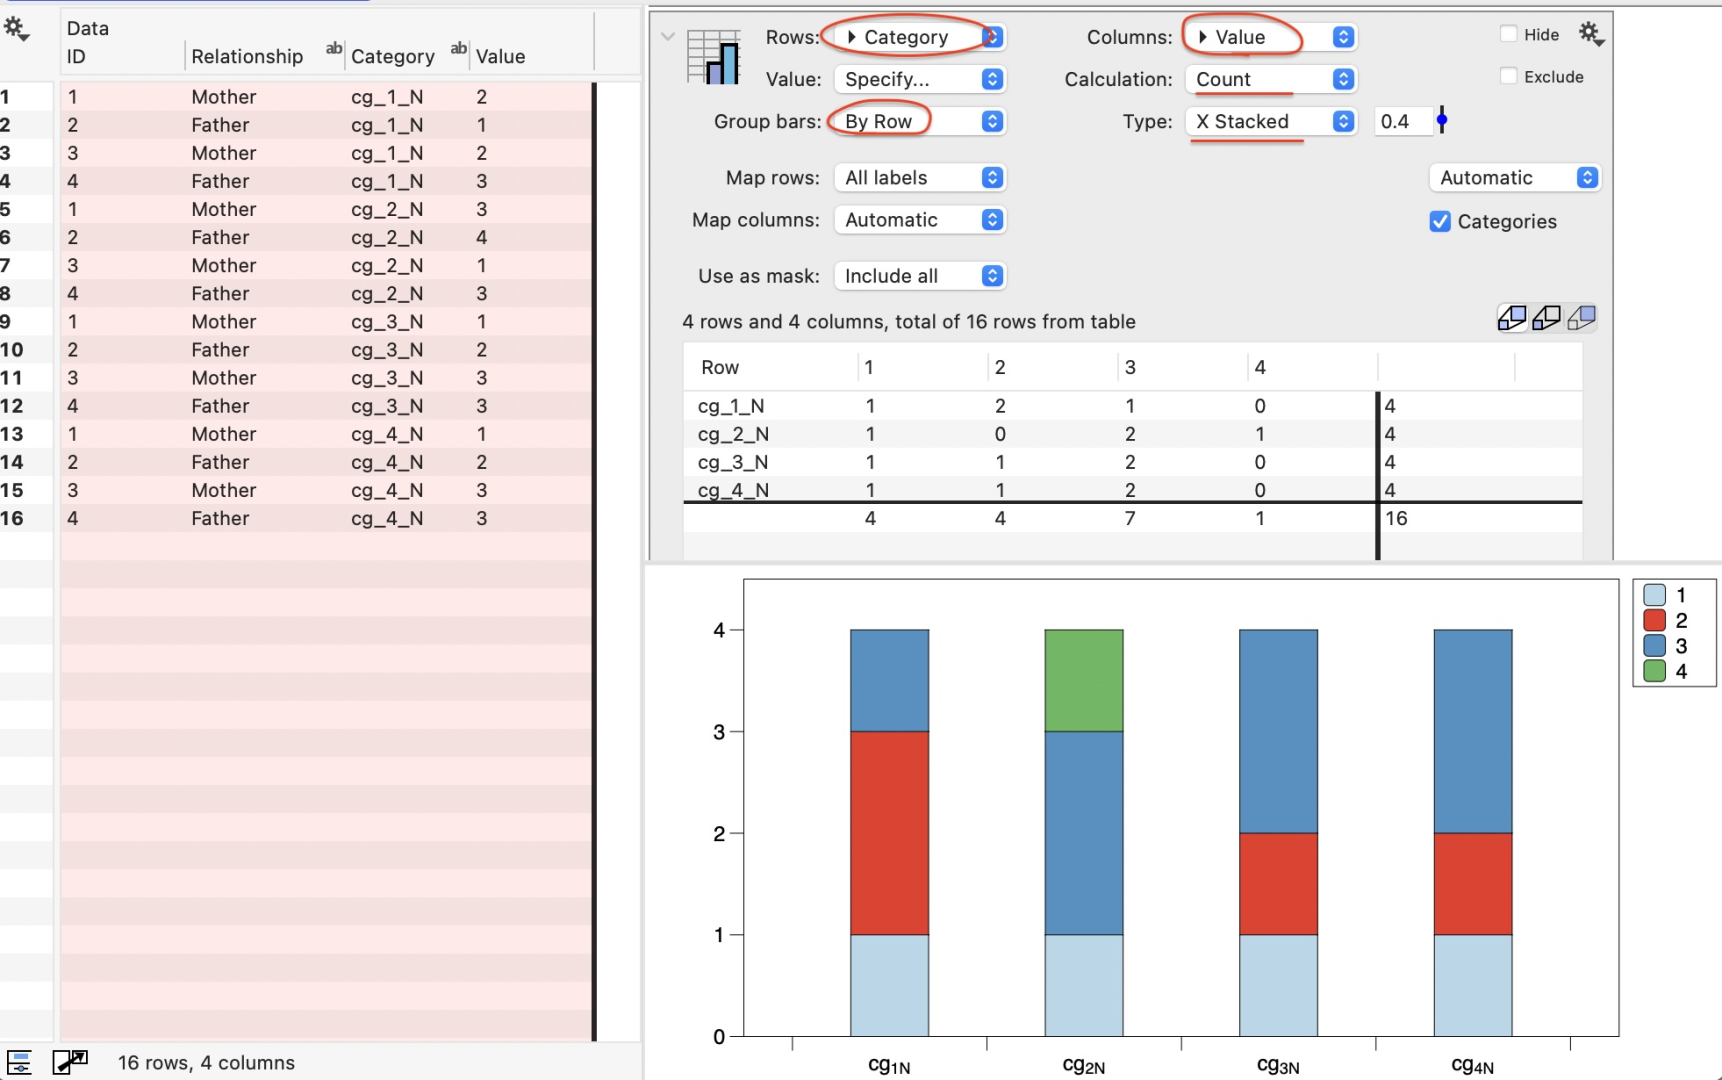
To use the Pivot command you would need to flatten data (link above).
Without flatten maybe you have something like this … where you can stack one column. This is a stacked bar that counts the number of responses for each category.
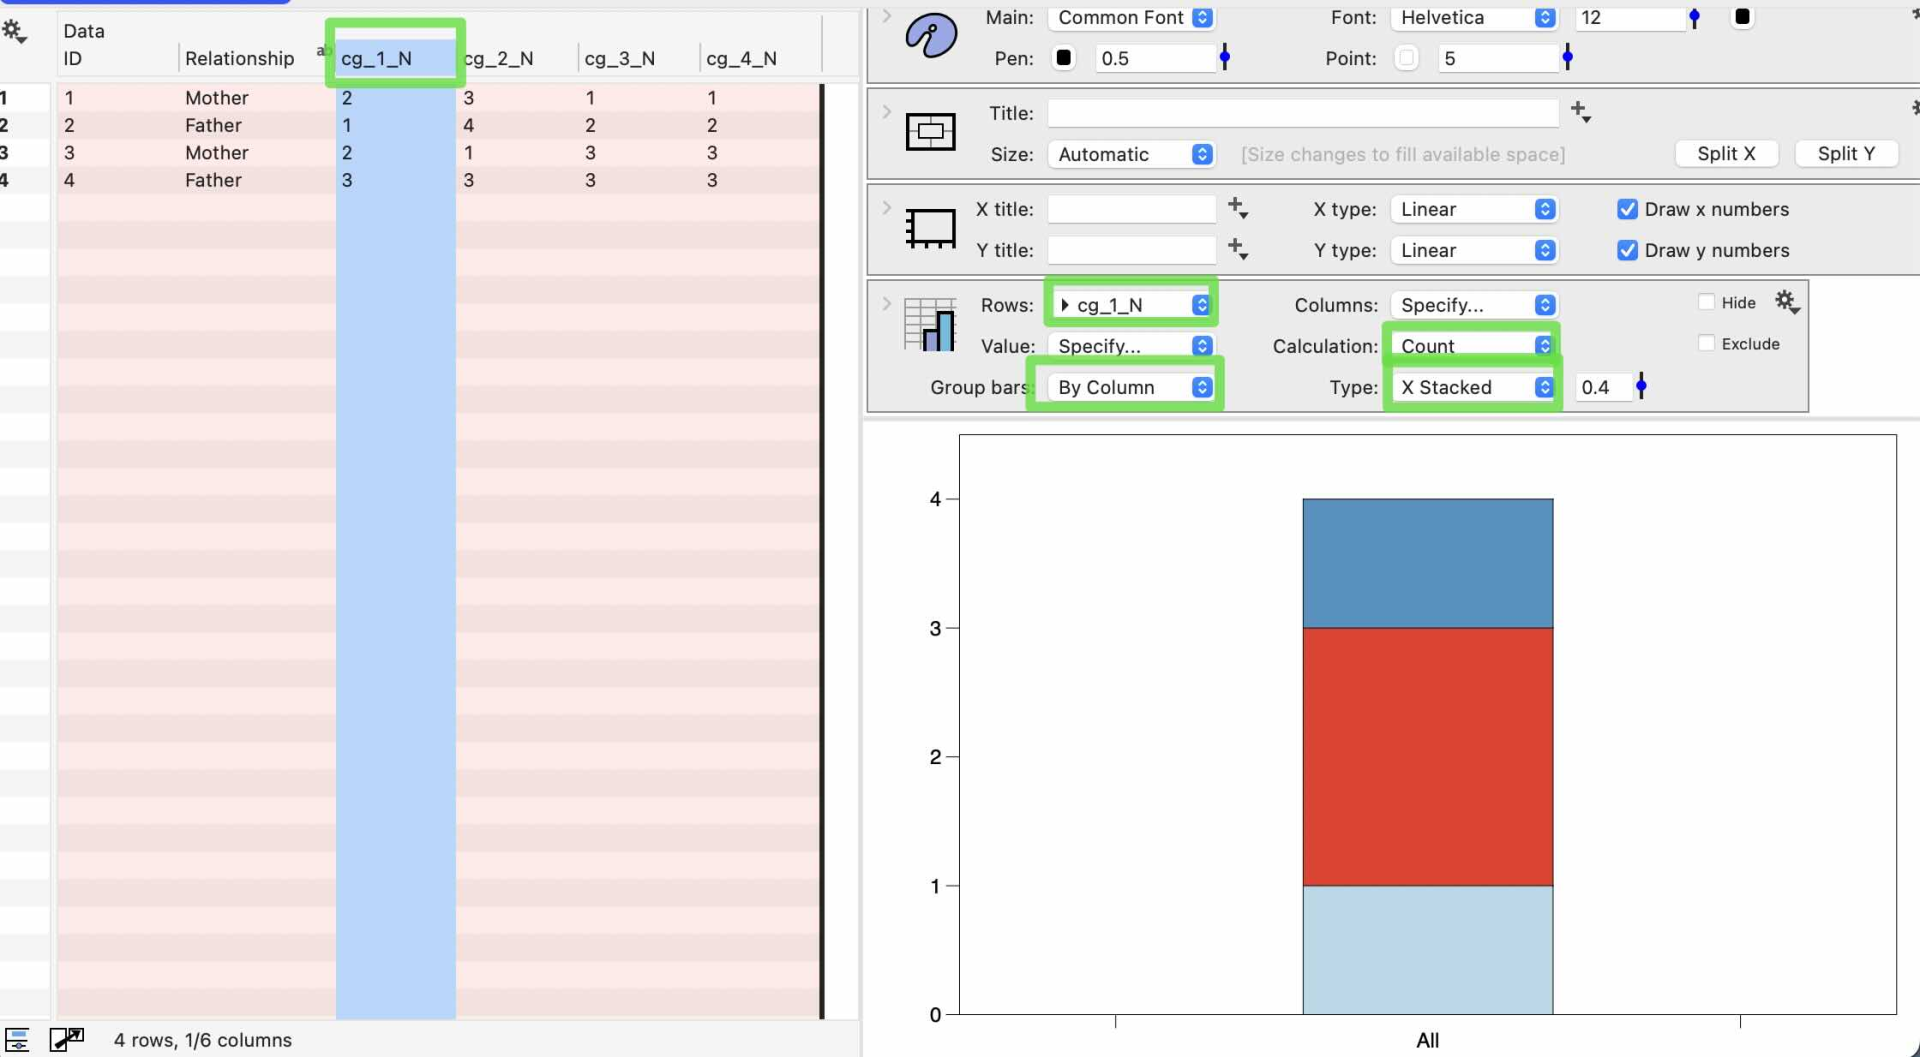
For the full use of the Pivot command you will need to flatten the data. Select all of the columns for your variables, and then select Data > Flatten columns from the menu bar.
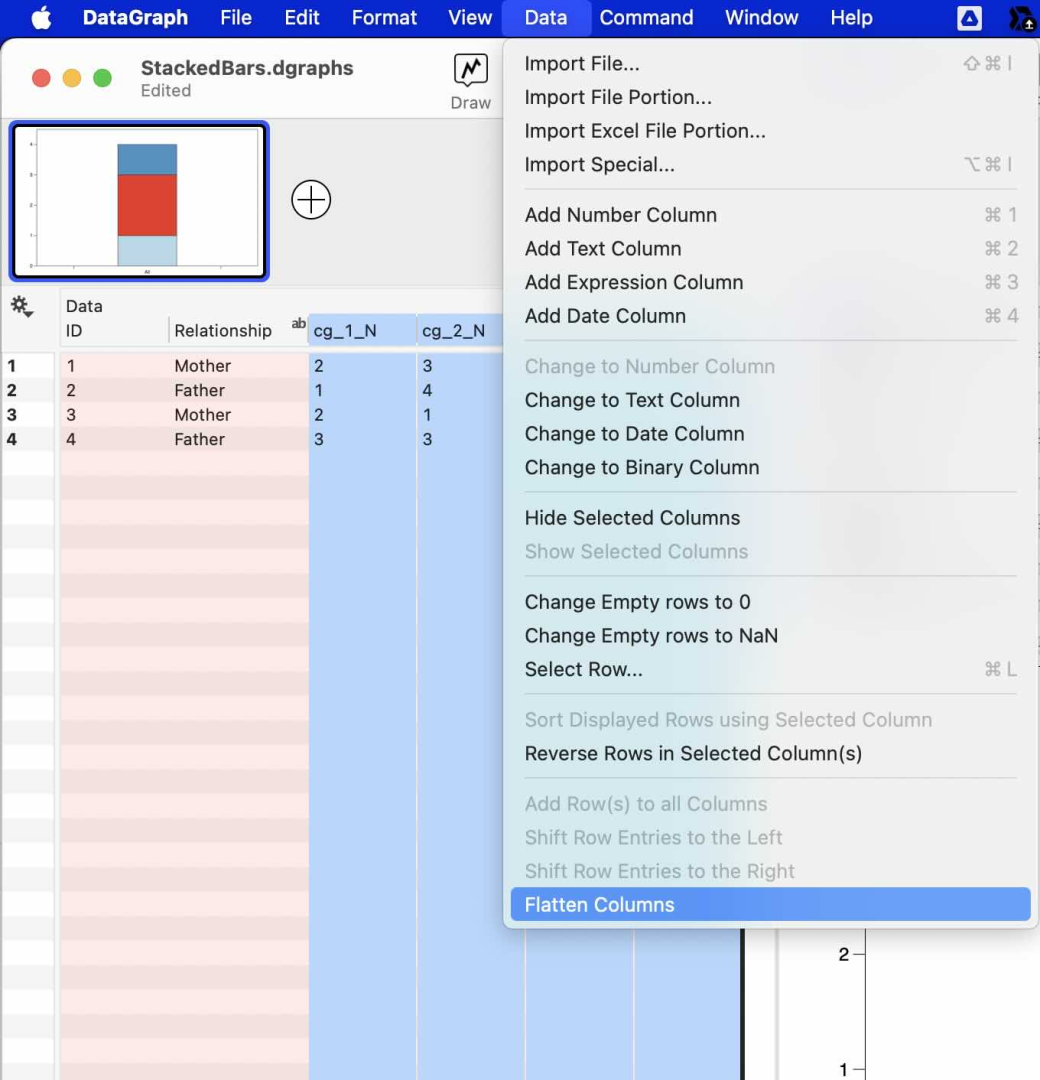
Your data will then be in a long format. Then you can create something like this … where this is counting for each category, the number of responses of each value.
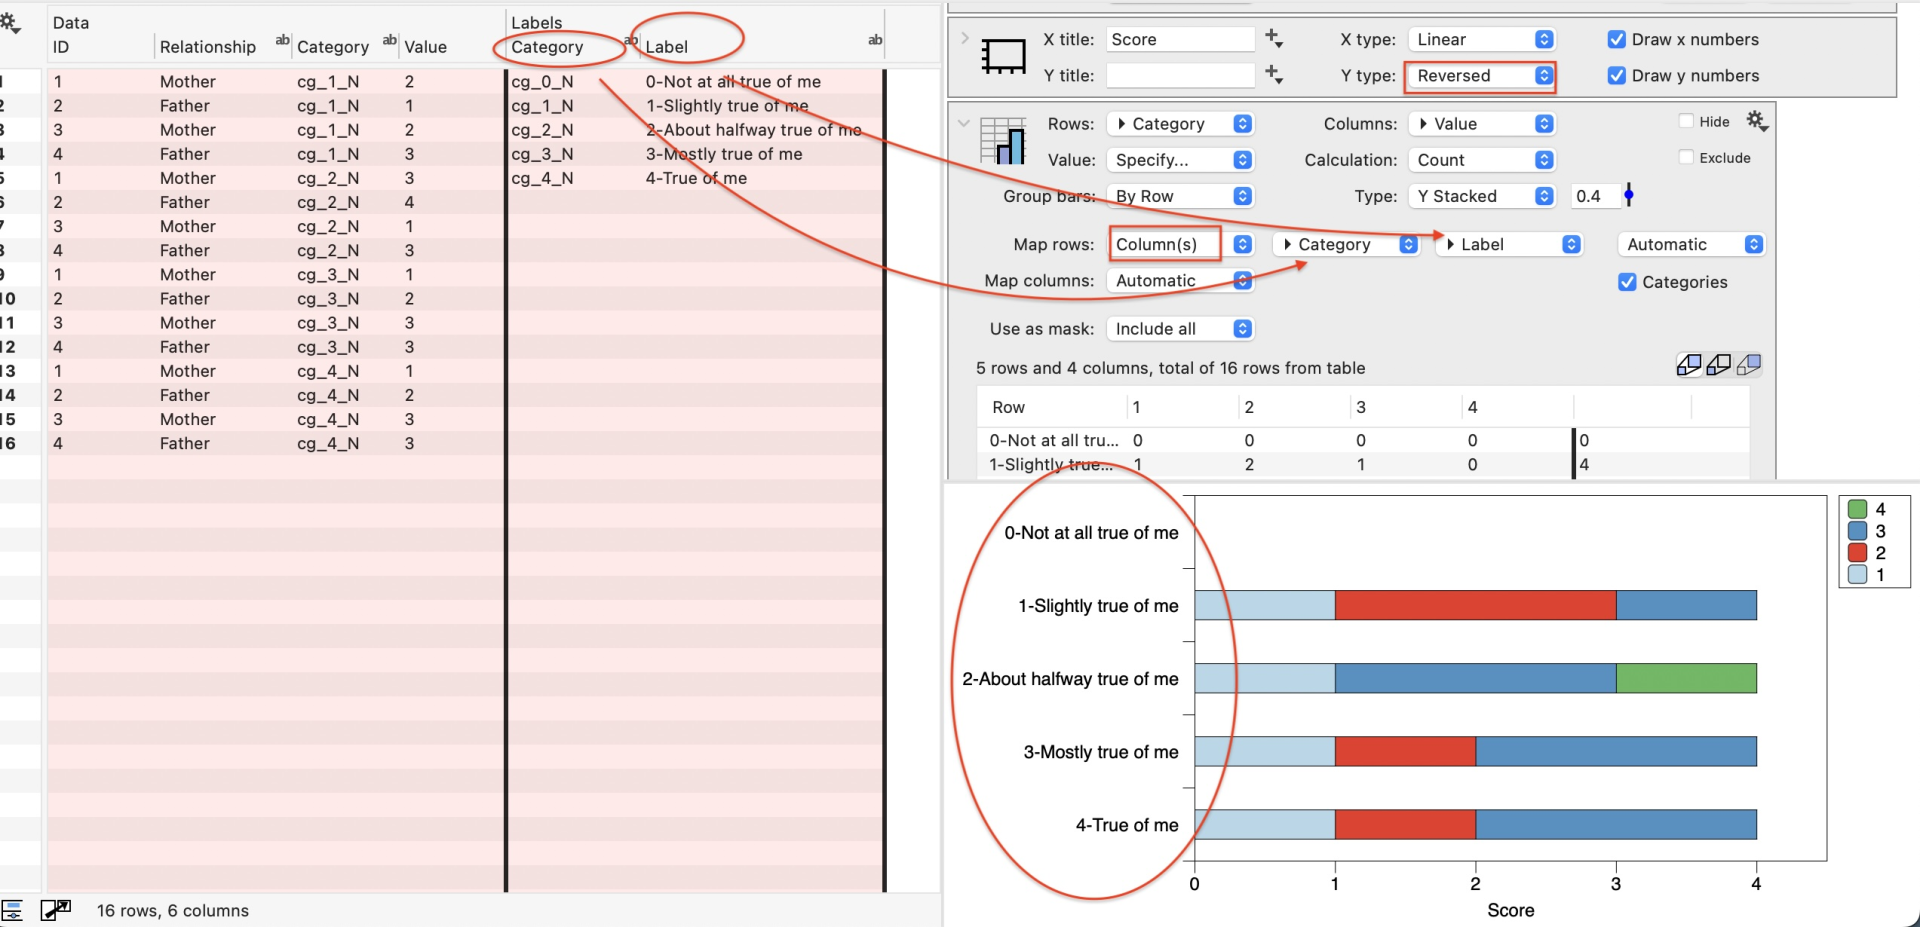
If you want to show the label that describes the category on the axis label, then you can use the map functionality, as shown below. You might also change this to a Y stacked to give more room for the axis labels.
To show in percentages, change the Calculation option on the Pivot command to ‘Row % Count’ .
Is this the kind of graphic you are lookin for? It seems it would be a number of ways to slice and dice the data beyond counts, if this is not what you are looking for, feel free to reach out with more details.
November 18, 2025 at 3:39 pm #15857ParticipantThank you. That was very helpful and instructive.
-
AuthorPosts
- You must be logged in to reply to this topic.
DataGraph Forums › Technical Support › Support Desk › Stacked bar charts