david

Forum Replies Created
-
AuthorPosts
-
It is in the gear menu – Subtract.
To compute the background there are several methods.
You might be able to take a particular time value
That is in the gear menu: Time Values -> Pick Time Value(s)You can also take the median of a few time values
Or if there is an gradient in the background you can use a morphological operation.
Excellent! The point about visualization AND simulations is exactly the goal.
There are three different 3D diagrams
3D Space – aspect ratio 1, there is an axis drawing command but it doesn’t draw any tick marks or labels at this time. The axis is primarily to help orient you.
2DZ – xy is space but z is separate (but linear, can’t be logarithmic). Currently there is no axis command here.
XYZ – A 3D version of the standard XY graph. Here there is an axis, each direction can be linear or logarithmic as well as reverse.
Which of these are you referring to?
Sorry I missed that. Yes, if you get a crash report, please send it to david@visual…
Reverting can be tricky, in particular since IT allows you to change parts even when things are running.
I couldn’t replicate this issue. Is the bounding box empty? Check the latest version (just uploaded it). Can you sent me a simple file in e-mail (david@visual…)
David
-
This reply was modified 1 year, 6 months ago by
david.
I don’t know if the macOS supports a third button natively. For some actions I use control/shift/option/command to modify the click. For example shift-drag will zoom in/out.
I uploaded a new IT version. I added an offset to the label for 3D Space.
I just uploaded a new IT version that added column properties.
The way that it works is that in the Table->Map method, click on the + button and select “Add Column Property”. Select the column from the input table and what column property you want to compute. If you don’t specify a name the name is columnName.propertyName.
The value is the value in the z coordinate.
It would make sense to have an offset, which would be calculated the same as the font size. The font size is based on the font scale set in the axis settings.
You can drag objects between files, or option-drag inside the file.
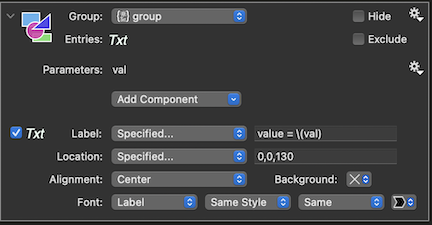
I use a syntax borrowed from swift. In the below example I select a group variable with a ‘val’ member variable. In the label field I can reference that by using the syntax
\(expression)
where expression can reference variables from the group.
I’m not familiar with scilab. I thought it was similar to matlab in that you use interpreted scripts or possibly just in time compiling.
Can you create a standalone application or do you need to run what you create in scilab?
-
This reply was modified 1 year, 6 months ago by
-
AuthorPosts
