Hello,
I have a data set which has 4 columns:
date/ YYYY-MM-DD
extraction time/ s
yield/ g
grind setting/ text
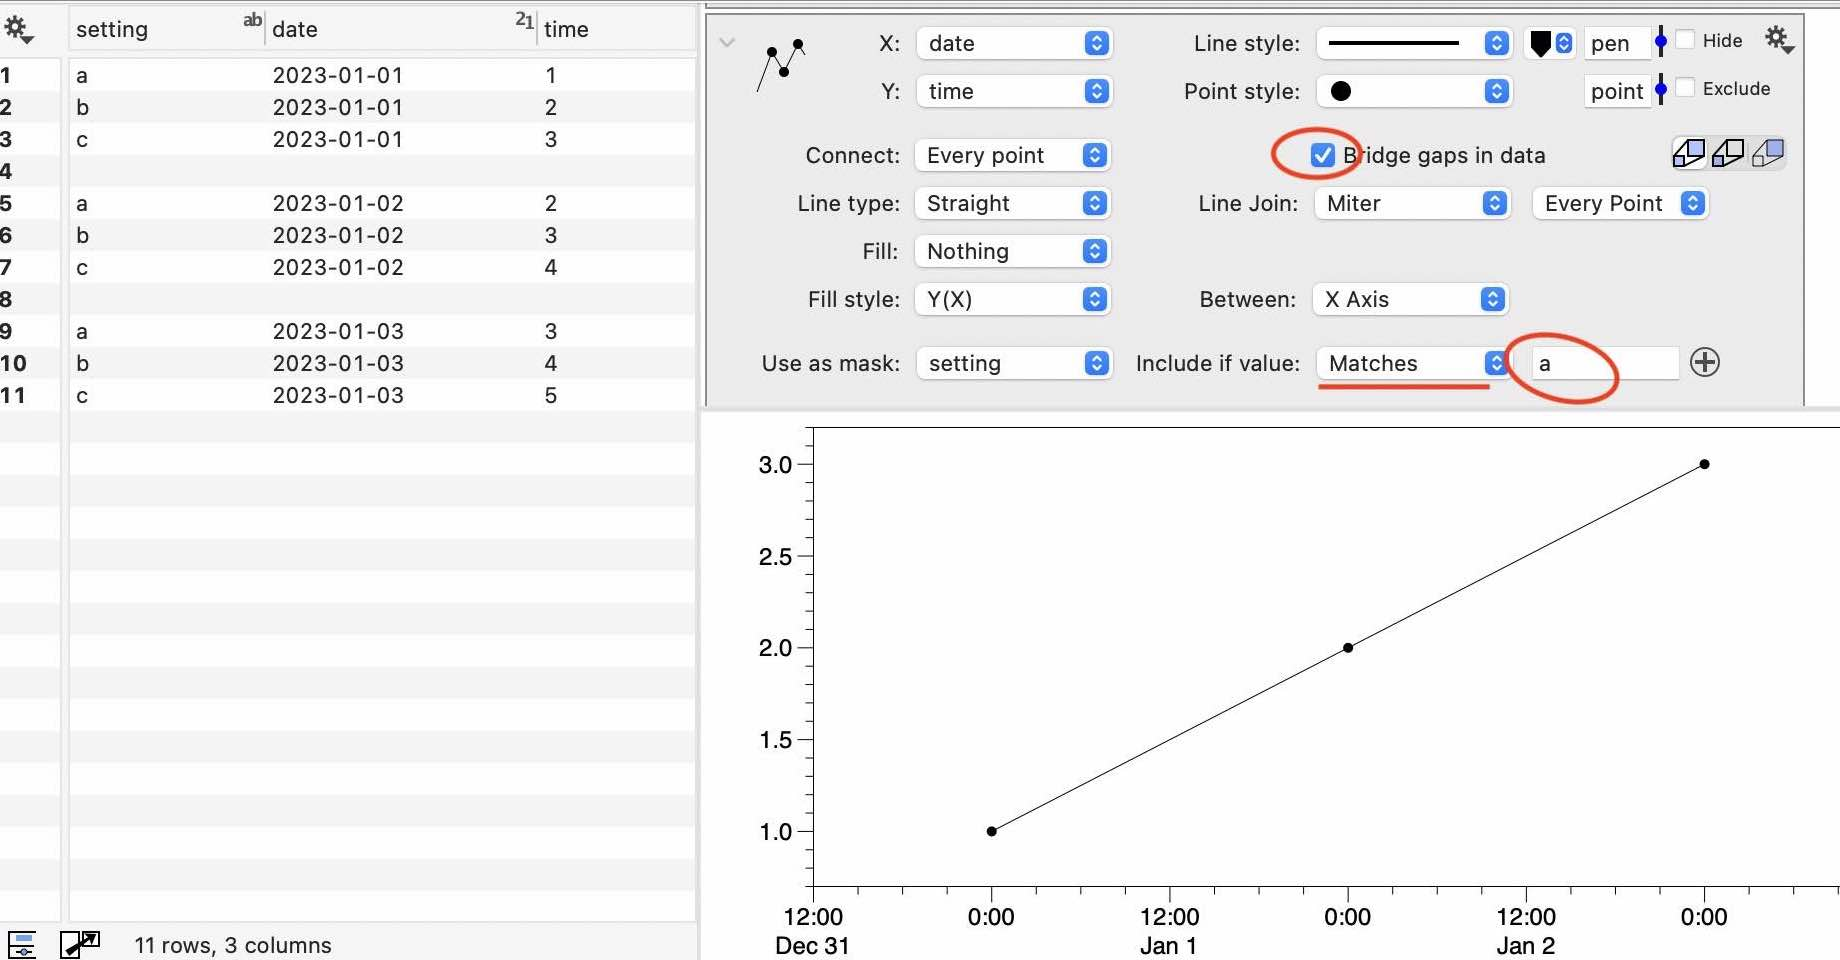
I want to see, for each grind setting, how extraction time varies by date. I cannot find a way to group my existing data within datagraph itself. I can’t find a way to filter data based on the grind setting (the manual says “you can filter on text”, but when I tried that, it refused to filter on text. Possibly my misunderstanding). I can’t find a way to do a multi-key column sort and thus use range groups.
Do I need to partition my data into different column groups? That makes data input more complex for me.
Are there graph types that fit my requirements?
 dgteam.