Thank you for your fast response.
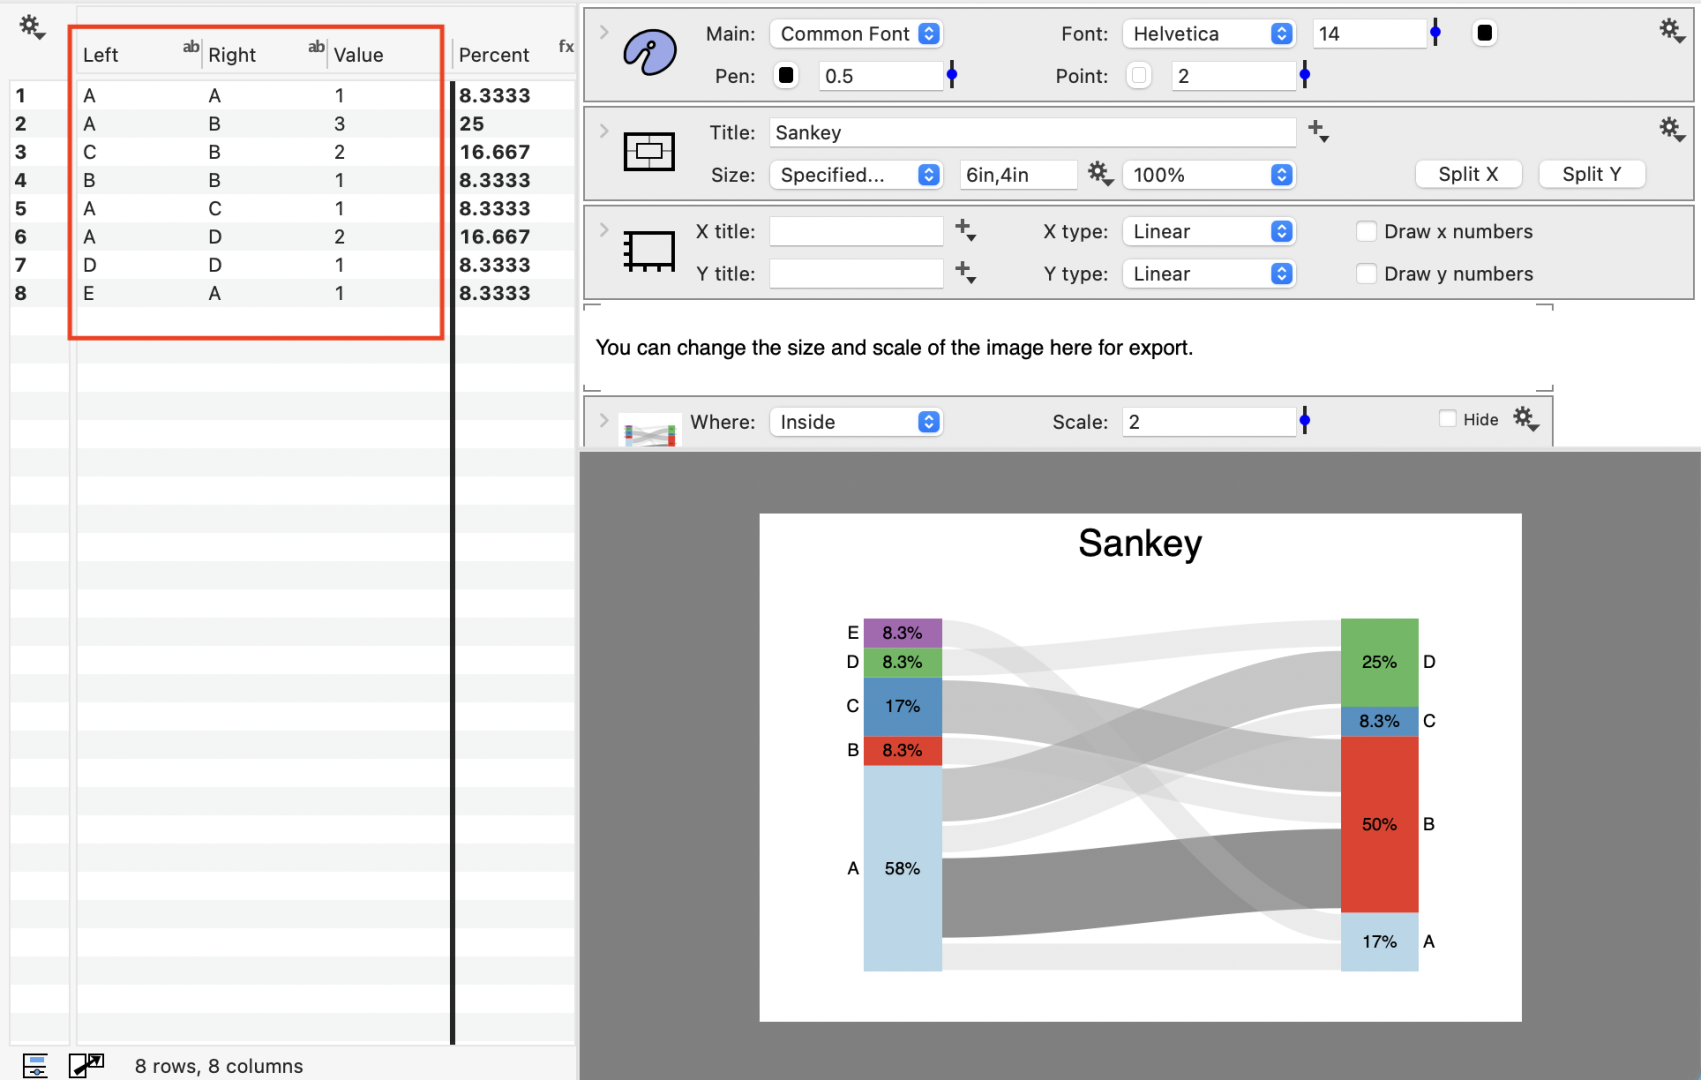
I was trying to build a Sankey Diagram from scratch, following the example but with only simple data. In my case I was trying to plot the quantity of metals (starting with copper) flowing from producer countries to consumer countries. This meant that my left and right columns were different. For example: Left = Producer = Chile, Zambia, Australia. Right = Consumer = China, USA, Japan etc. I did not want to calculate percentage, but to show total metal flow in millions of tonnes between producer and consumer.
I have not spent long on this so far, but was not making progress with the Sankey Diagram, whereas with other charts I have been able to understand the method and produce my own quite quickly. I will have another try later today.
iantownsend.
 iantownsend
 dgteam