Replace NaN with Empty?

DataGraph Forums › Technical Support › Support Desk › Replace NaN with Empty?

Viewing 3 posts - 1 through 3 (of 3 total)
  • Author
    Posts
  • #15810
    kirkt
    Participant

      I have a conditional expression that returns a value, otherwise returns NaN.  I want to replace NaN in the expression column with an empty value.  The context is, I have four columns that will have a conditional result (the value or NaN) and I eventually want to add all of the columns.  With an NaN in any of the columns, the sum is always NaN.

      How do I specify “empty” – either as the “else” part of the conditional result, or as a replacement for NaN?  All of the columns are of the type Number.

      Thanks!

      Kirk

      #15811
      dgteam
      Moderator

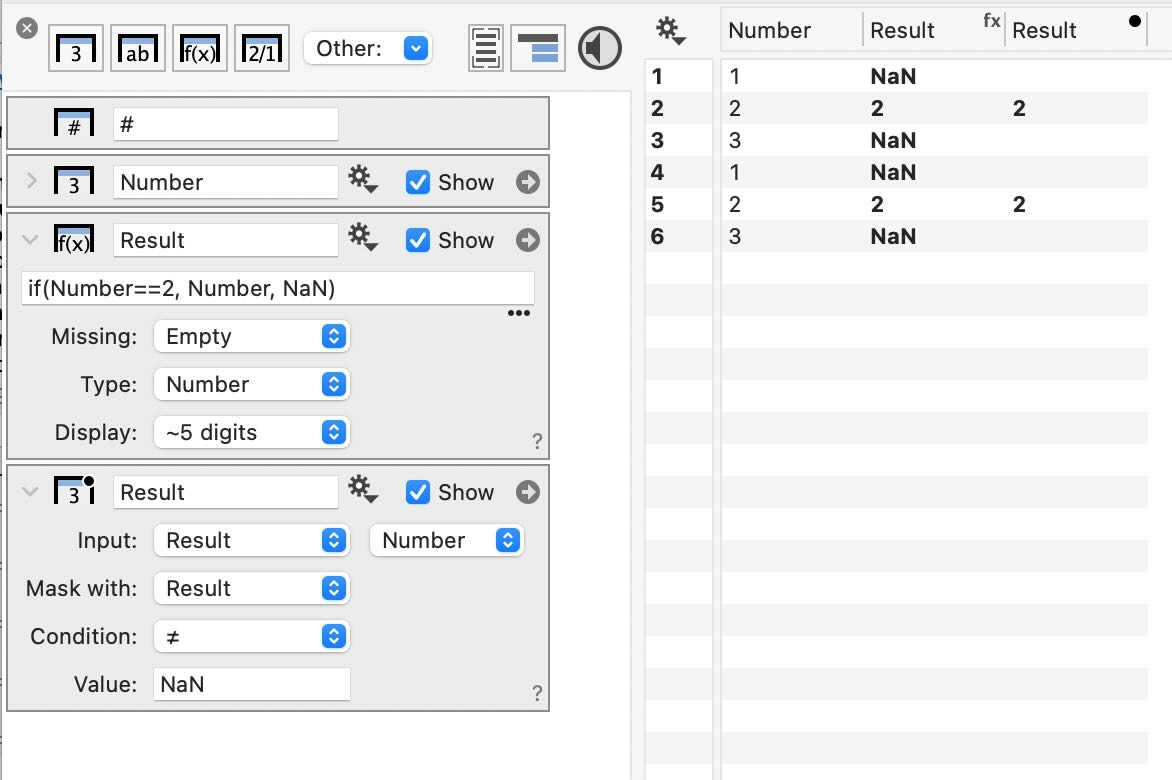
        Try using a Mask column to remove the NaN values.

        removenans

        Here this worked to remove NaN values.

        When you use columns with empty values in another expression, you may need to specify the Missing option in the expression column you use.

        Does this help?


        #15812
        kirkt
        Participant

          Works like a charm!  Thank you for this recommendation.  I have never used a Mask column, just masking within plots.  I learn something new every time I use this application and I LOVE IT!

          Thanks!

          Kirk

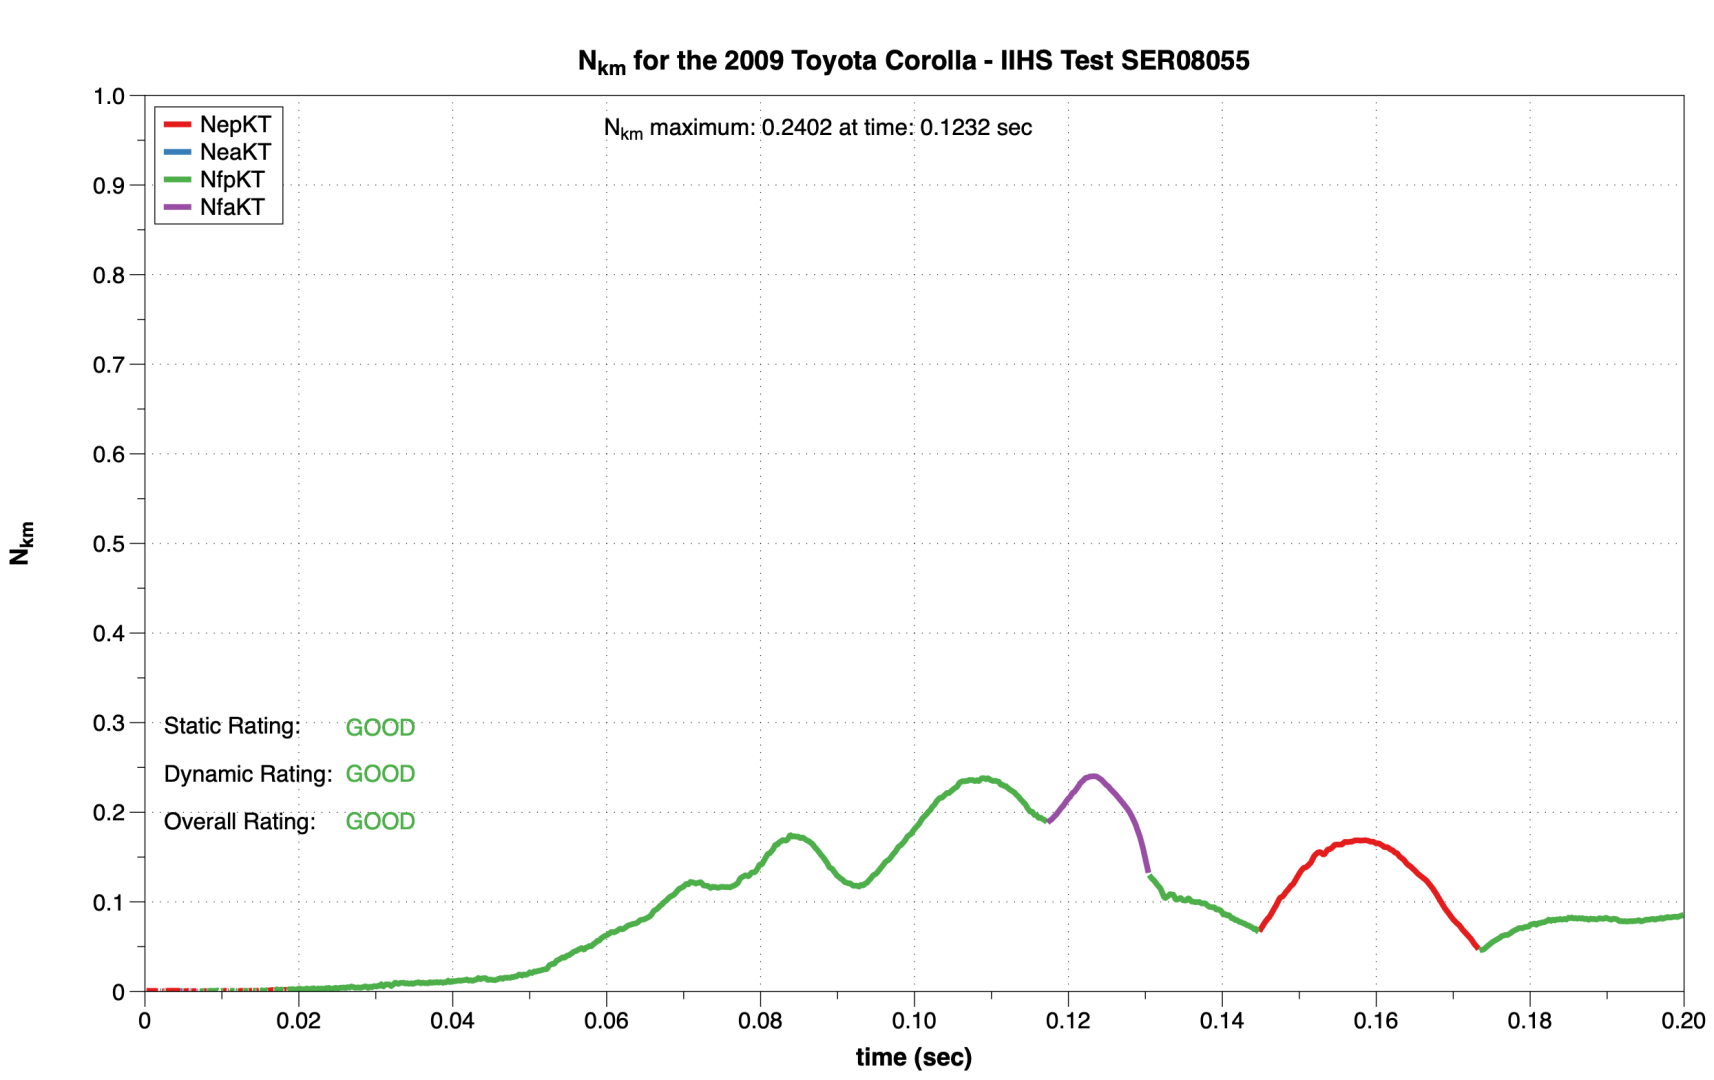
          PS – some additional context.  I am using DG to analyze automotive crash test data, including computing some calculated measures of injury tolerance.  For one parameter, there are four combinations of calculated values, depending upon when the time history of the head upon the neck response generates anterior (“a”) or posterior (“p”) shear force (Fx) and depending upon whether the sagittal bending moment (My) is in flexion (“f”)  or extension (“e”).  I use conditional expressions to parse the four conditions (ep, ea, fp, fa), calculate the value for that point in time – if the condition is satisfied, then the value is computed, otherwise, NaN.  This permits me to plot four separate conditions in a single plot with four colored segments depicting the particular condition at any point in time (First figure below).

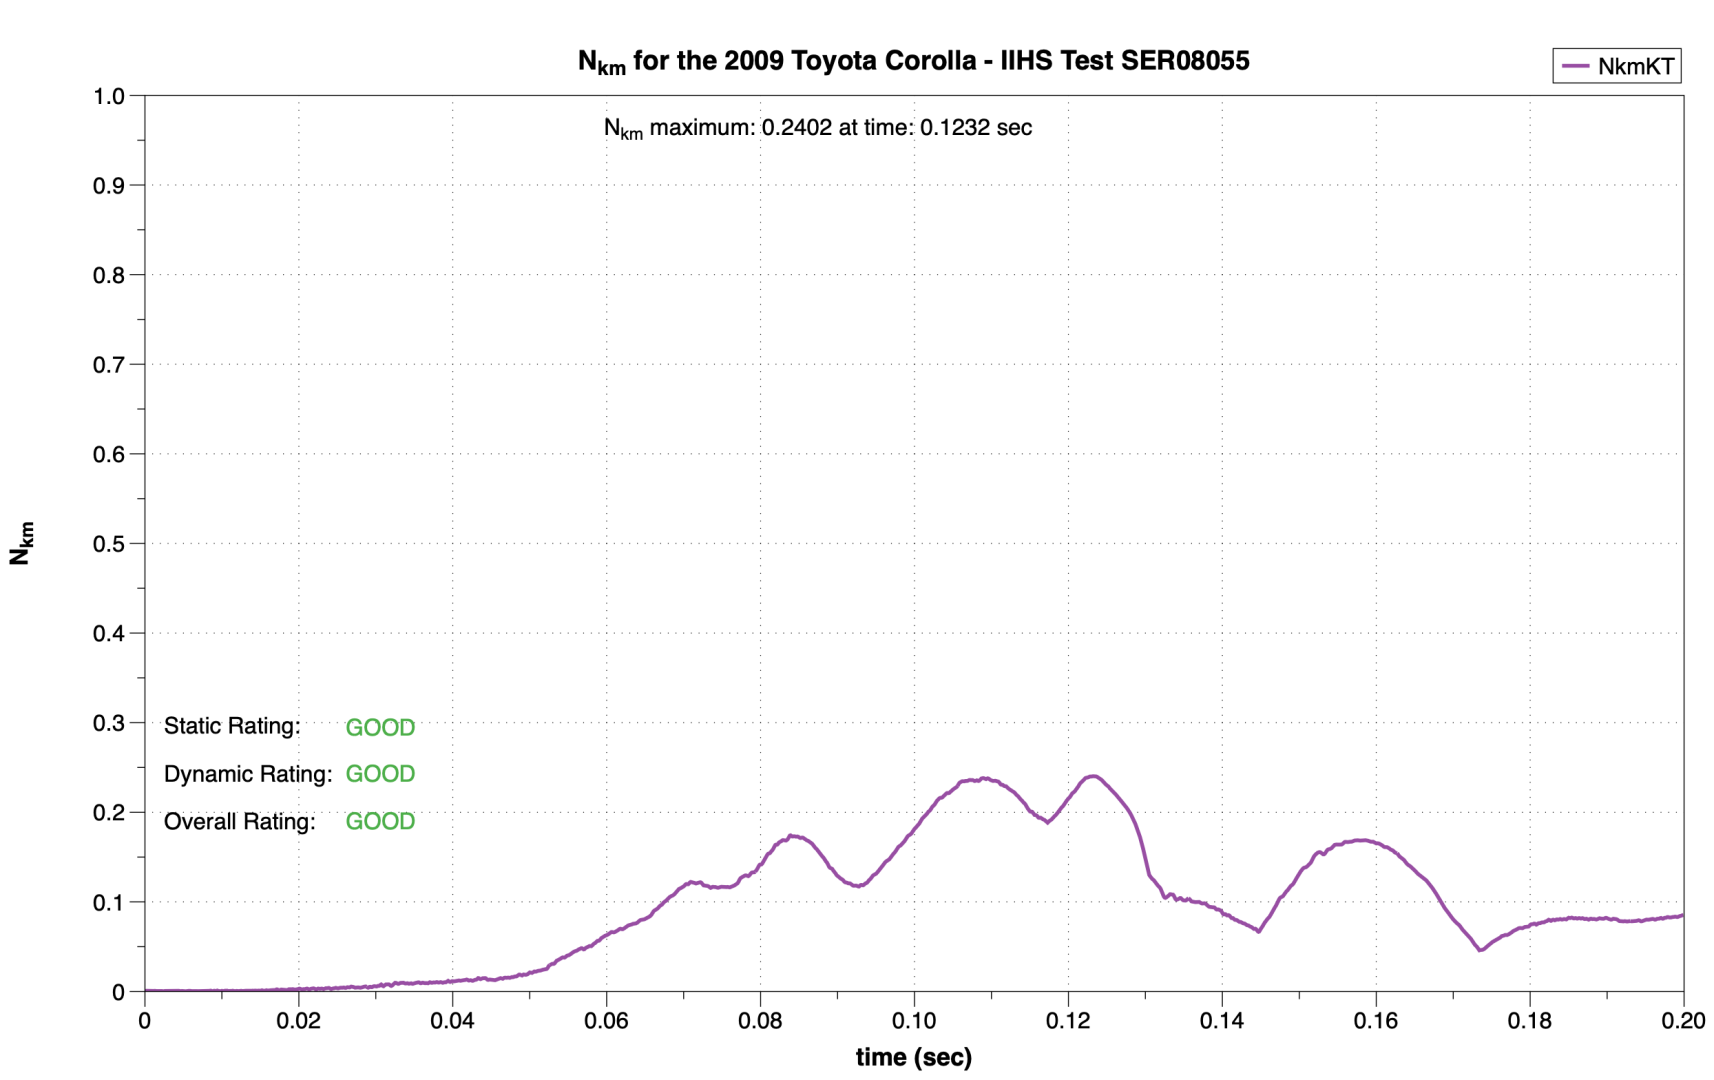
          Combining the four curves into a single curve, via the operation you suggested, provides a master curve from which I can pick the maximum value across the entire time history of the data (Second figure).

          The calculations in DG have been validated against R code I have written, as well as the calculated value produced by the test facility.
           

          NkmDEVNkmDEVMaster

        Viewing 3 posts - 1 through 3 (of 3 total)
        • You must be logged in to reply to this topic.

        DataGraph Forums › Technical Support › Support Desk › Replace NaN with Empty?