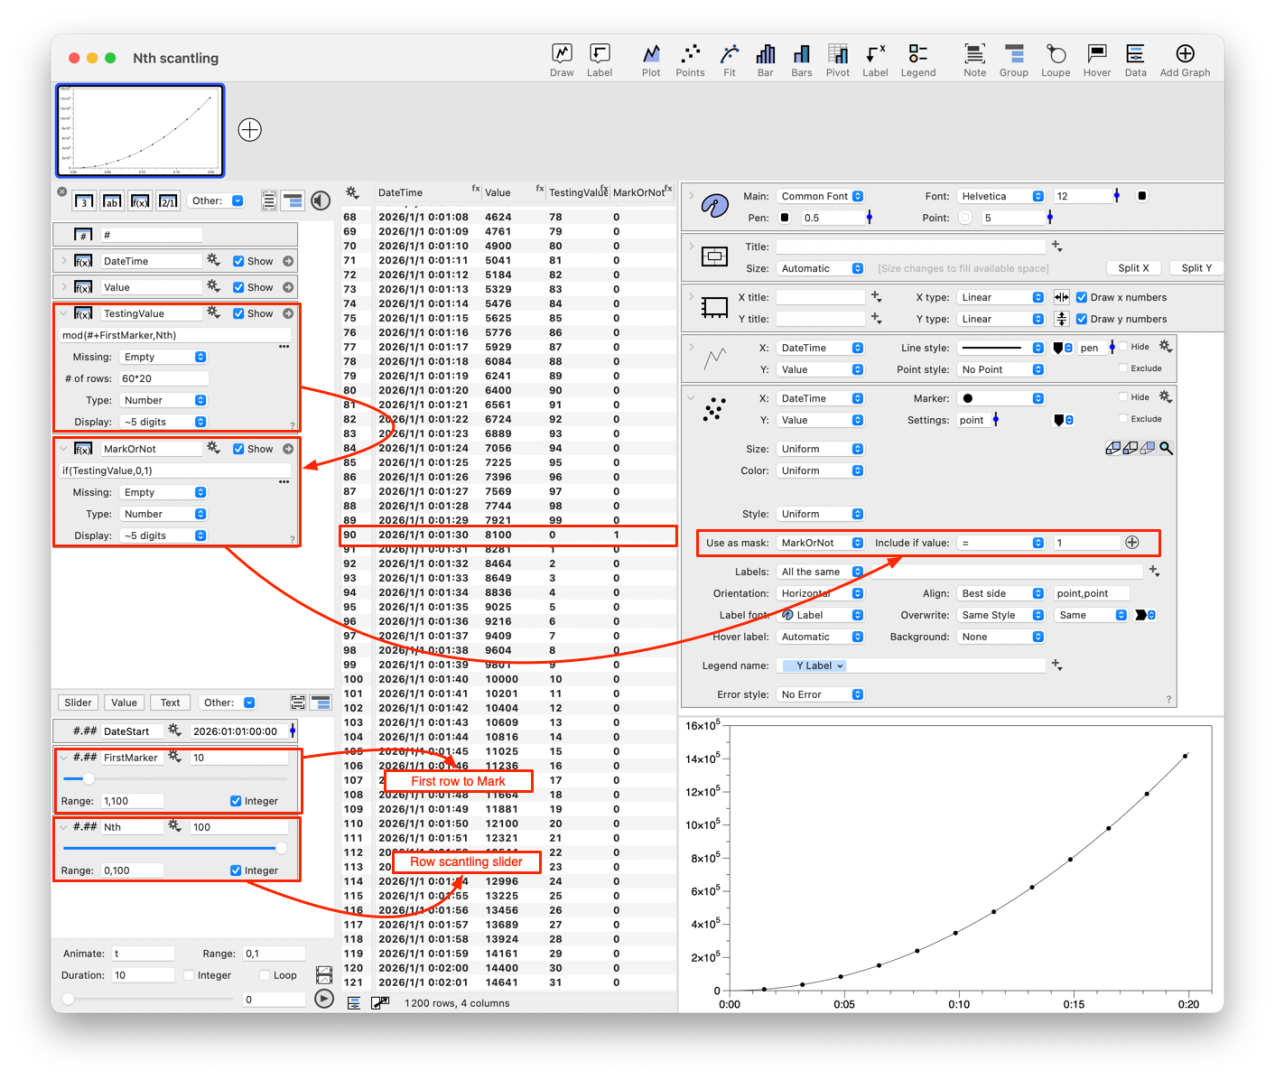
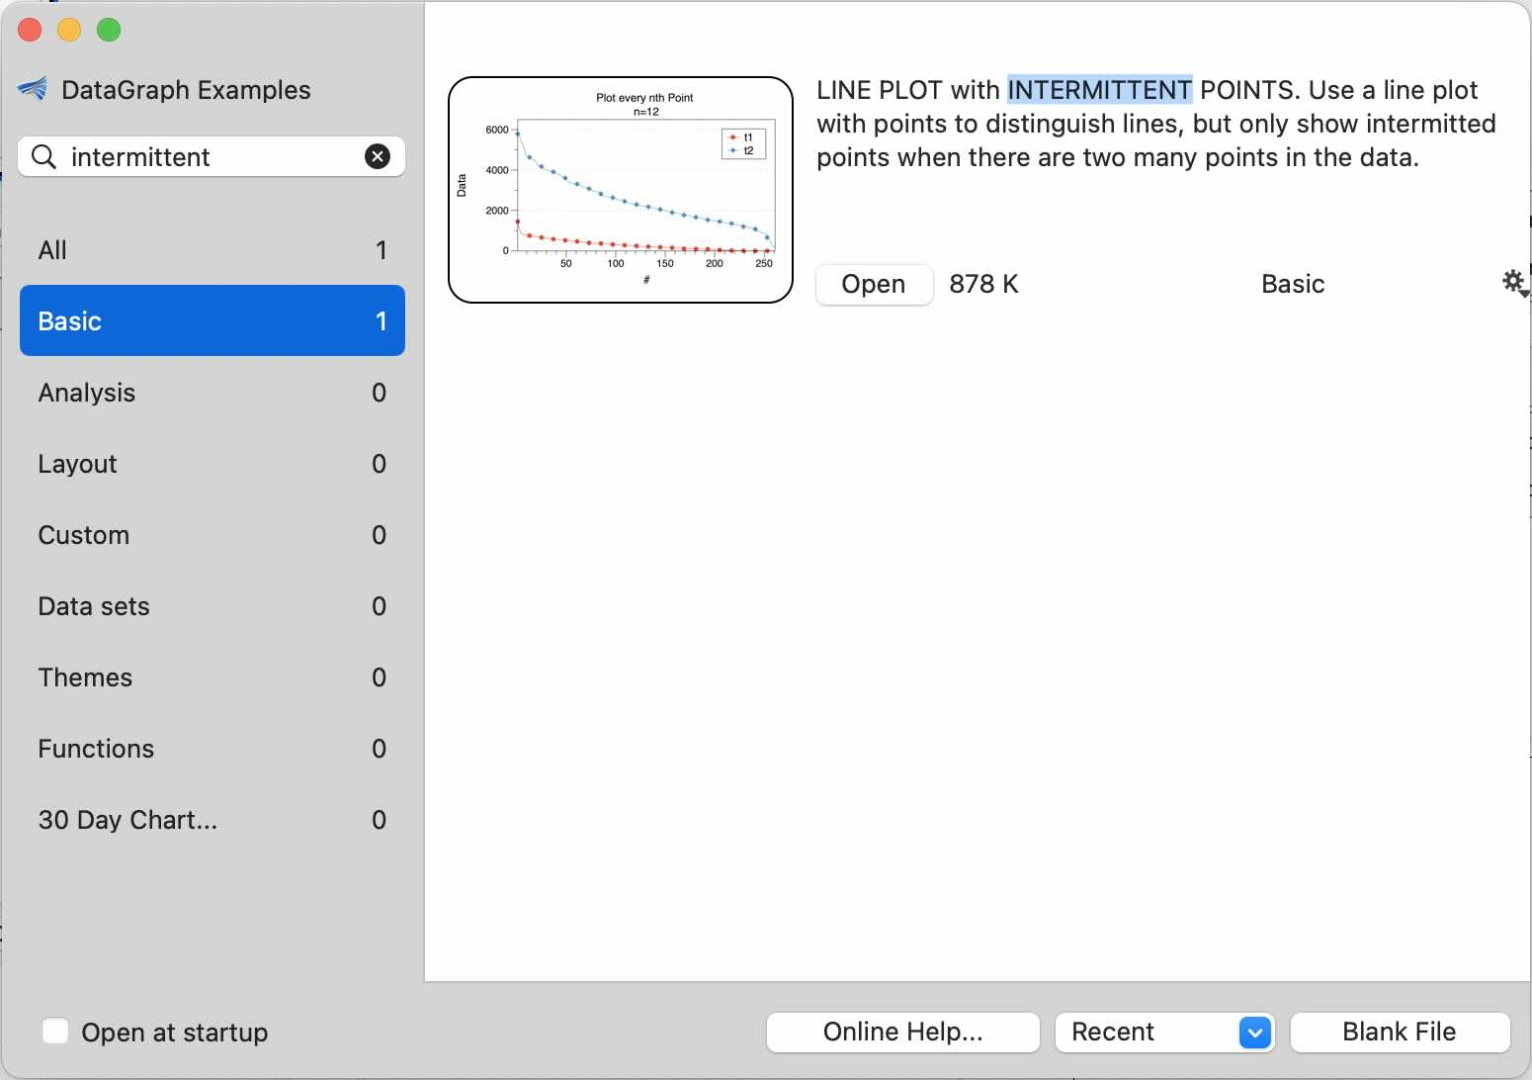
Place marker every Nth data point
- This topic has 7 replies, 3 voices, and was last updated 1 week, 5 days ago by
Jean-Yves Le Stang.
Viewing 8 posts - 1 through 8 (of 8 total)
 ronald parsons
 Jean-Yves Le Stang
 dgteam
Viewing 8 posts - 1 through 8 (of 8 total)
- You must be logged in to reply to this topic.