Obtain a MEAN for select rows from a number column

DataGraph Forums › Technical Support › Support Desk › Obtain a MEAN for select rows from a number column

Viewing 3 posts - 1 through 3 (of 3 total)
  • Author
    Posts
  • #15549
    david blackwell
    Participant

      Hi,

      I’ve been a user of Datagraph since 2011 and am very familiar with most aspects. One aspect I am less familiar with is the use of expressions. I have a .dgraph file which list my weights, blood pressure, pulse, and daily steps with data going back to 2001.

      This is probably an easy one, but I’m having a mental block. I wish to develop a variable which gives me the mean value of a portion of my WEIGHT column, say from a specific date on forward, i.e from 2022:04:15 to present.

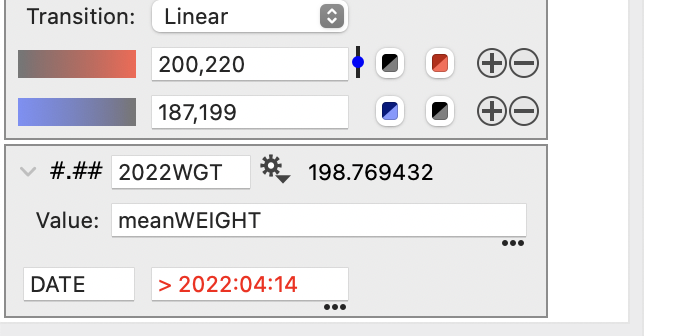
      I tried creating a mean variable as shown below, but I’m unclear on whether I can and how to filter on a specific date and forward. An image is below. The value displayed is correct for ALL records, but not for only records beyond April 2022. That should be closer to 183.

      Note: In the image, the Value in the expression box is a named variable obtained from right-clicking on the WEIGHT column and choosing the mean number for all values in the column WEIGHT.

      Can anyone help here? Much appreciated.
      datagraphVar


      David Blackwell
      Seattle, 12 MAR 2025

      #15550
      dgteam
      Moderator

        Hi David!

        The mean variable will always include all the data in a column. Instead, you can first filter the data using a Masked column and then take the mean of the Masked column.

        Here is the associated help page: Masked column

        Please let us know if that is unclear or if you have other questions.


        #15551
        david blackwell
        Participant

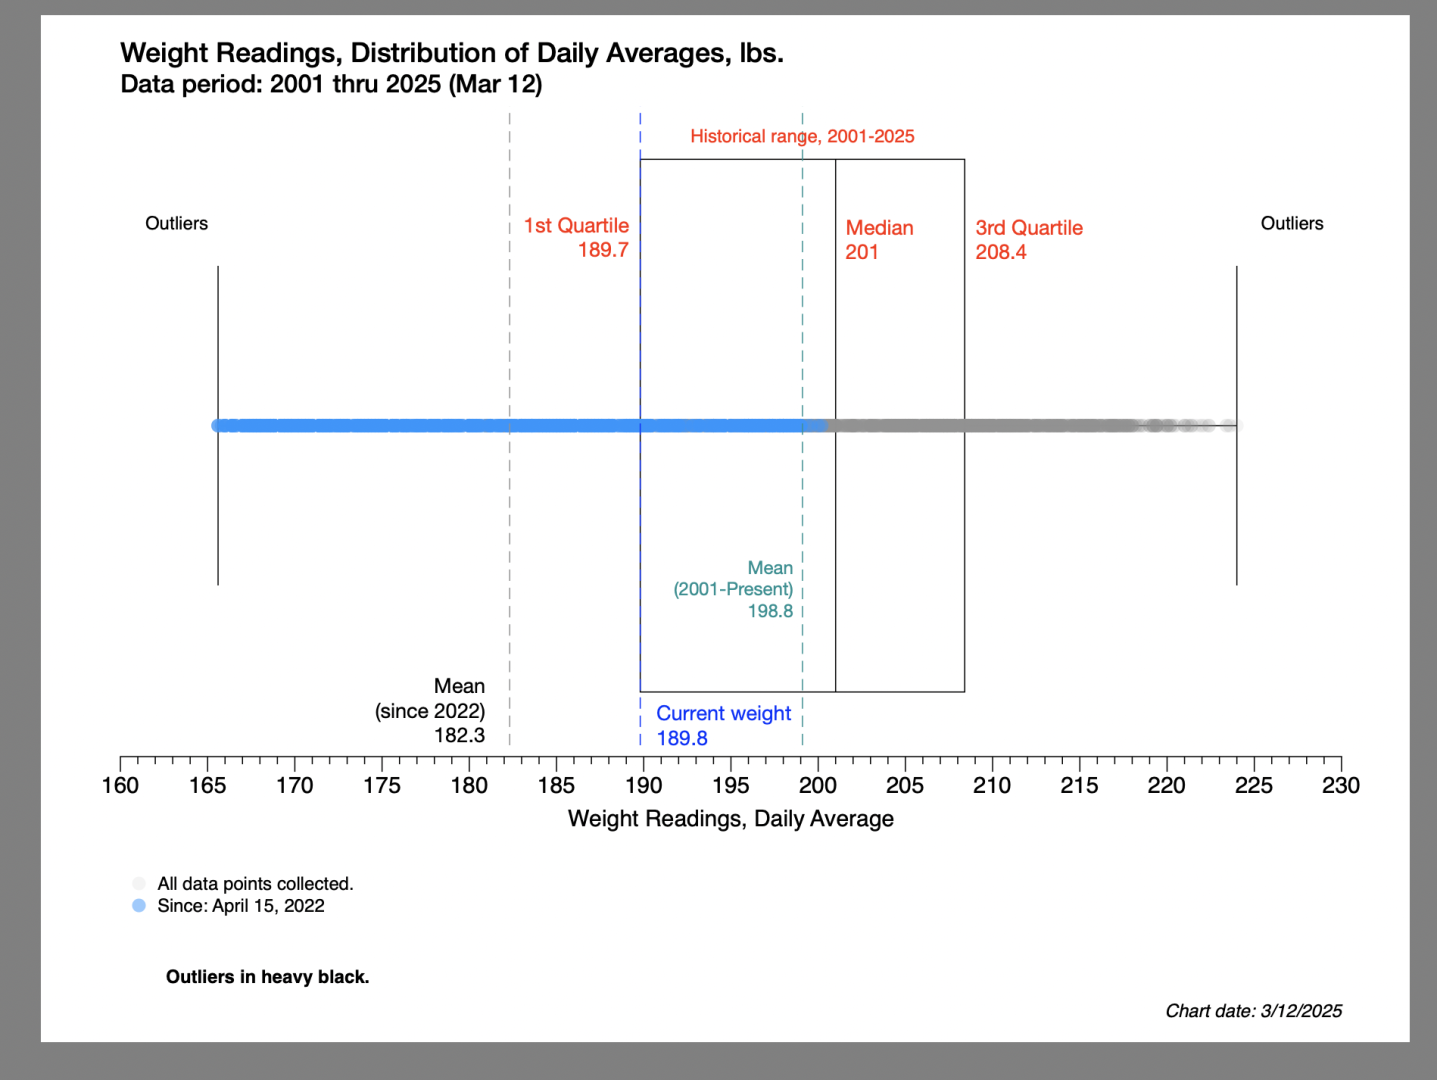
          Oh, thanks so much. Your suggestion works like a charm and I was able to get it to work in less than a minute. This enables me to automate it’s continuous change in value without having to open the source Excel file and select all of the cells for weight for all of the impacted dates, record the mean value for the selection, and then manually type it into my Datagraph file. In just one chart I’m able to automate the ever-changing value in several places: (1) a vertical dashed line representing the weight value (182) along the x-axis; and (2) a number variable within a label (see image below for Mean Weight since April 15, 2022).

          And I use this value in several other charts. I think I’ve done this (or similar) before with a masked column, but I forgot the technique. I’ll have to practice several times and make some notes for future reference.

          Many thanks for the prompt reply.

          maskedWeightScreen

        Viewing 3 posts - 1 through 3 (of 3 total)
        • You must be logged in to reply to this topic.

        DataGraph Forums › Technical Support › Support Desk › Obtain a MEAN for select rows from a number column