Sankey Diagram

DataGraph Forums › General › Getting Started › Sankey Diagram

Tagged: 

Viewing 3 posts - 1 through 3 (of 3 total)
  • Author
    Posts
  • #15781
    iantownsend
    Participant

      I am a retired, non-commercial user of Datagraph for analysing personal and community project data, and for personal research.  I am very much a beginner but I am trying to expand the range of graphs I understand and can use.

      I would like to create a Sankey Diagram as shown in the Datagraph examples.  However, I have not yet been able to get it to work with my own data.  Can anyone please talk me through the process step by step or point me towards other sources of information?

      #15783
      dgteam
      Moderator

        Hi Ian,

        Glad you found us 🙂

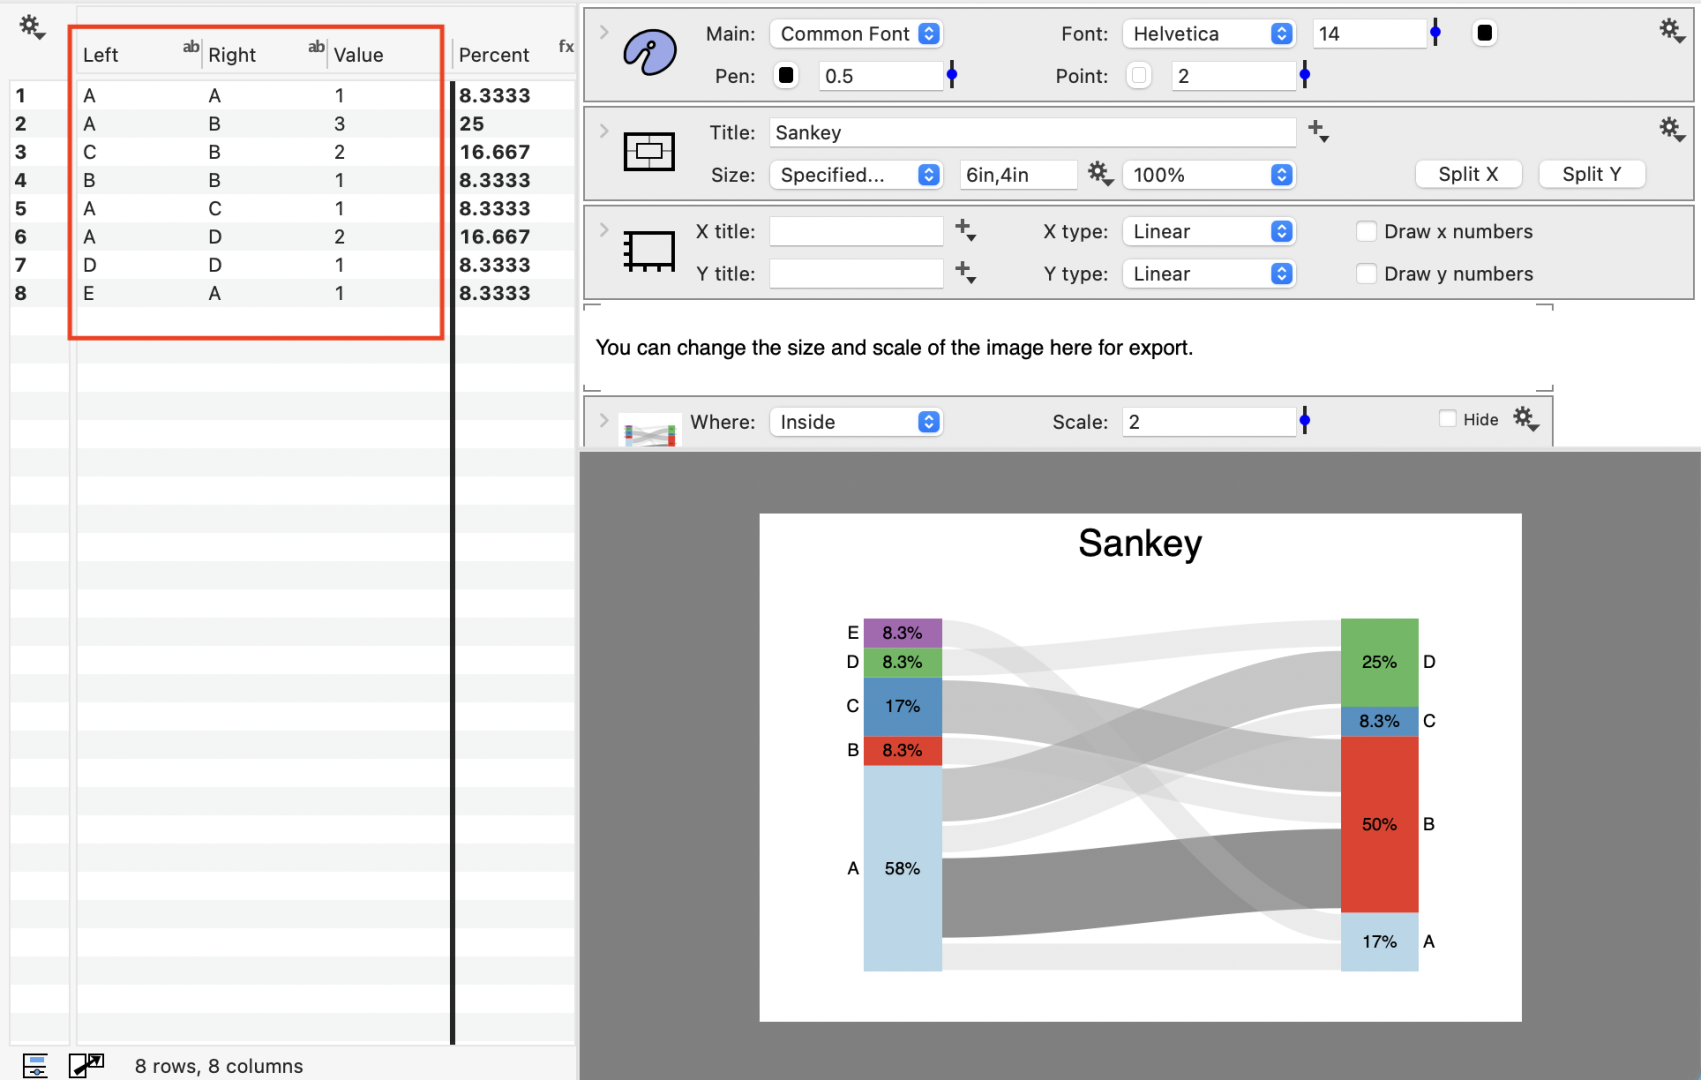
        Here is a screen shot from the Sankey template in the example files. Is this the file you are trying to use?

        The key to using this would be likely to have the data in this format. Then, you could paste your data in and the template should update.  If you could share more detail on where your stumped that would be helpful.  Or if you can show an image that is closer to what you’re trying to achieve.

        sankey

        #15784
        iantownsend
        Participant

          Thank you for your fast response.

          I was trying to build a Sankey Diagram from scratch, following the example but with only simple data.  In my case I was trying to plot the quantity of metals (starting with copper) flowing from producer countries to consumer countries.  This meant that my left and right columns were different.  For example: Left = Producer = Chile, Zambia, Australia.  Right = Consumer = China, USA, Japan etc.  I did not want to calculate percentage, but to show total metal flow in millions of tonnes between producer and consumer.

          I have not spent long on this so far, but was not making progress with the Sankey Diagram, whereas with other charts I have been able to understand the method and produce my own quite quickly.   I will have another try later today.


        Viewing 3 posts - 1 through 3 (of 3 total)
        • You must be logged in to reply to this topic.

        DataGraph Forums › General › Getting Started › Sankey Diagram