Easier on the Eyes
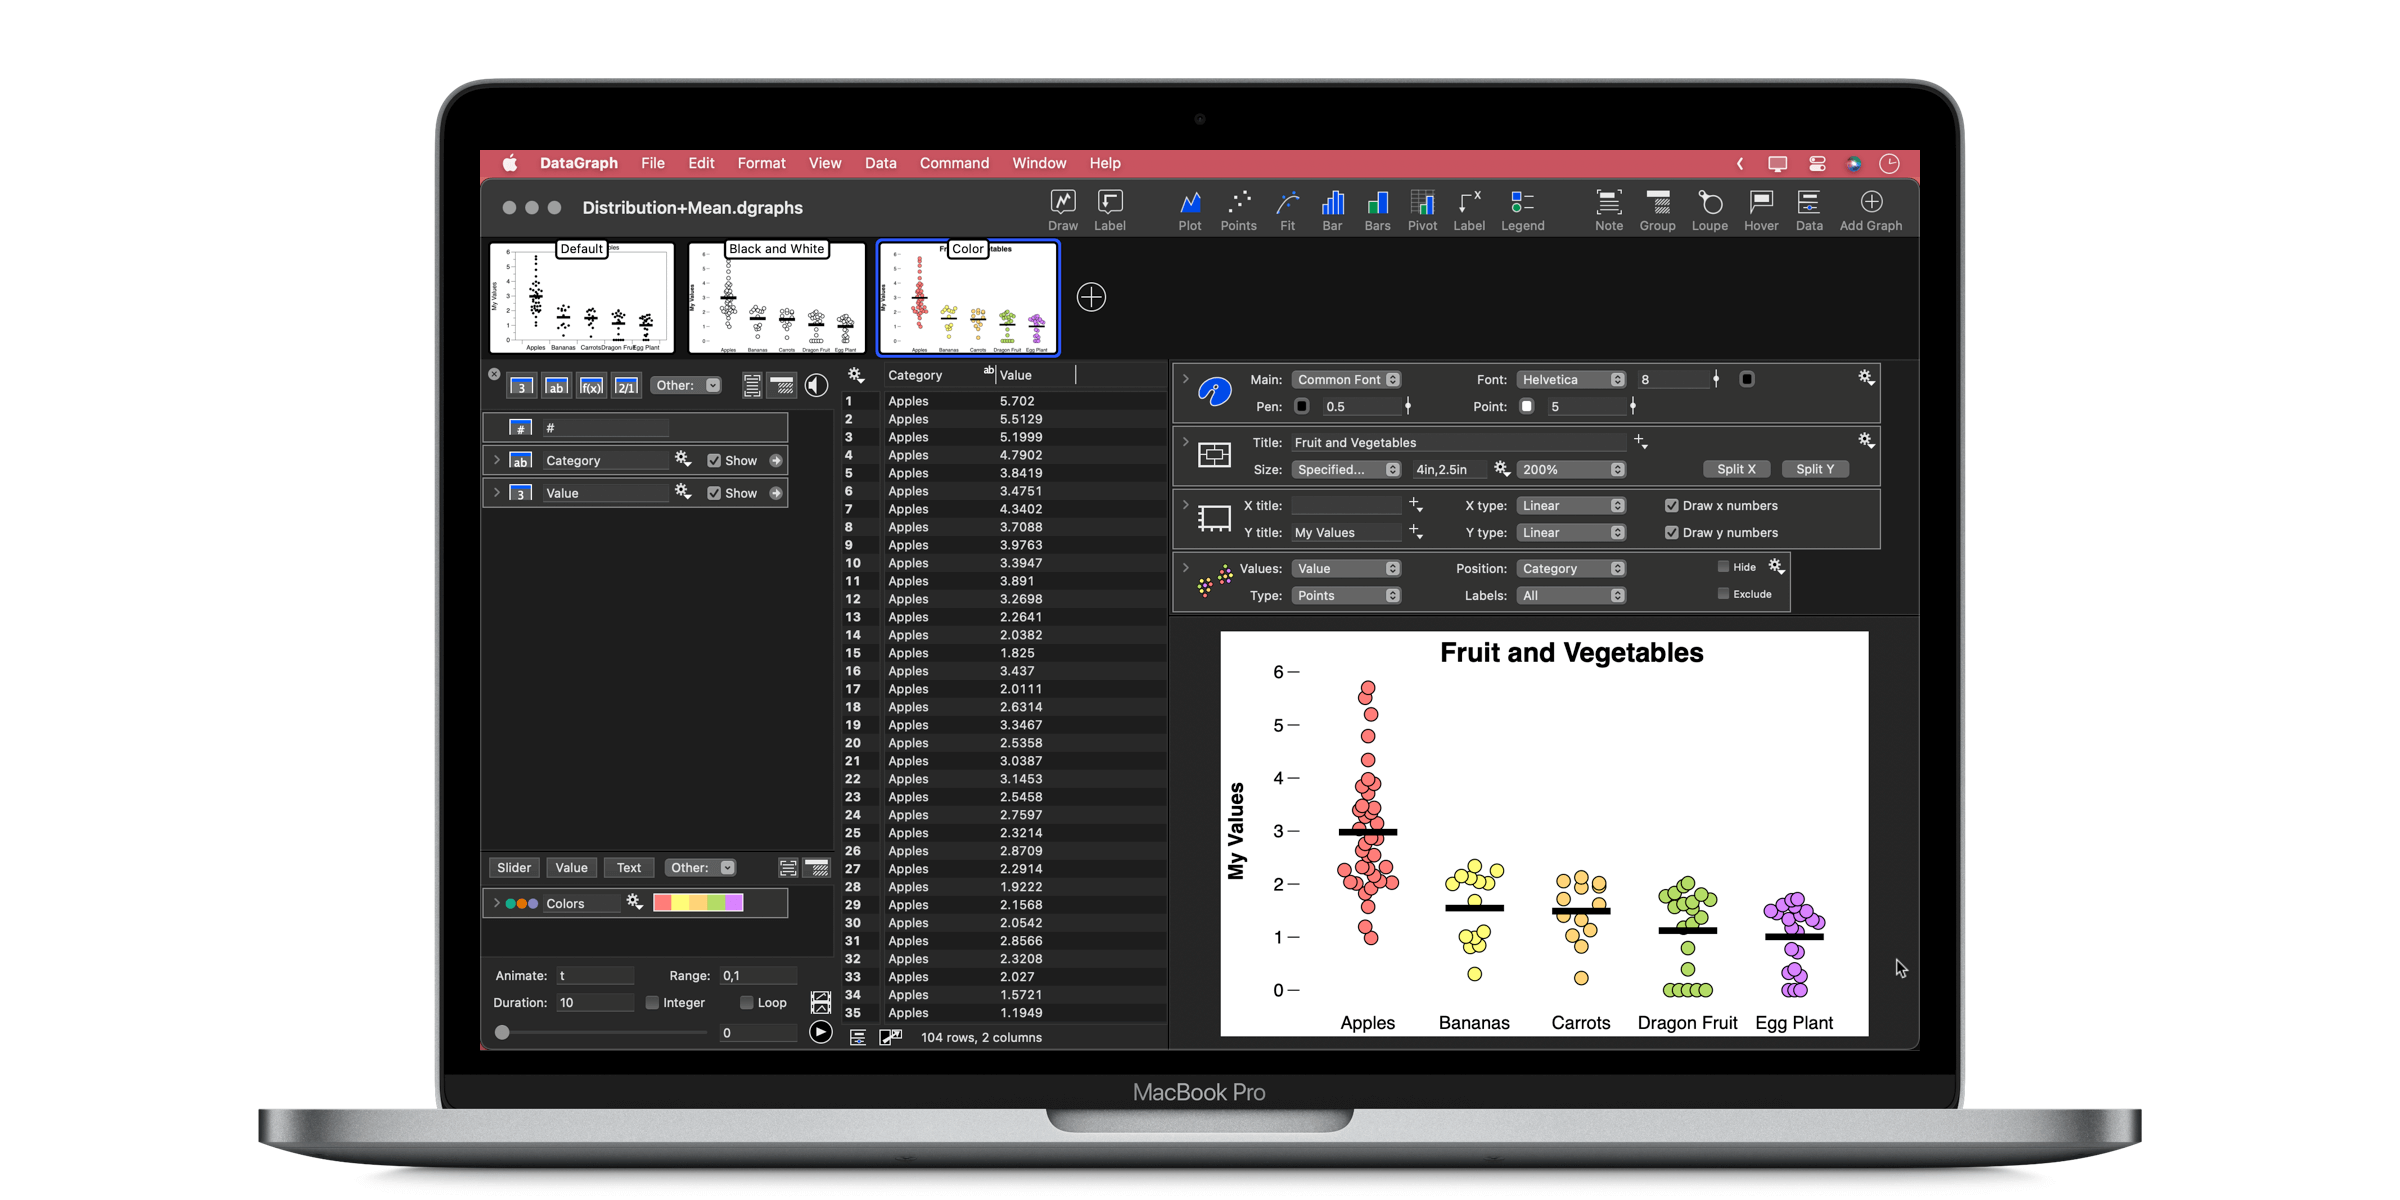
Now, you can zoom in and out on the data table. This lets you magnify your data or get a bird’s-eye view of multiple columns and rows. Use the ‘Zoom in or out’ trackpad gesture or go to View > Zoom Table in the menu bar.
- Use the pinch+zoom gesture on the trackpad in the data table to zoom in/out.
- Text wrapping is used for longer text entries in the data table. Double-click on a text entry, and the box expands as needed.
- Text Box expands for long column headers.

More Style Options
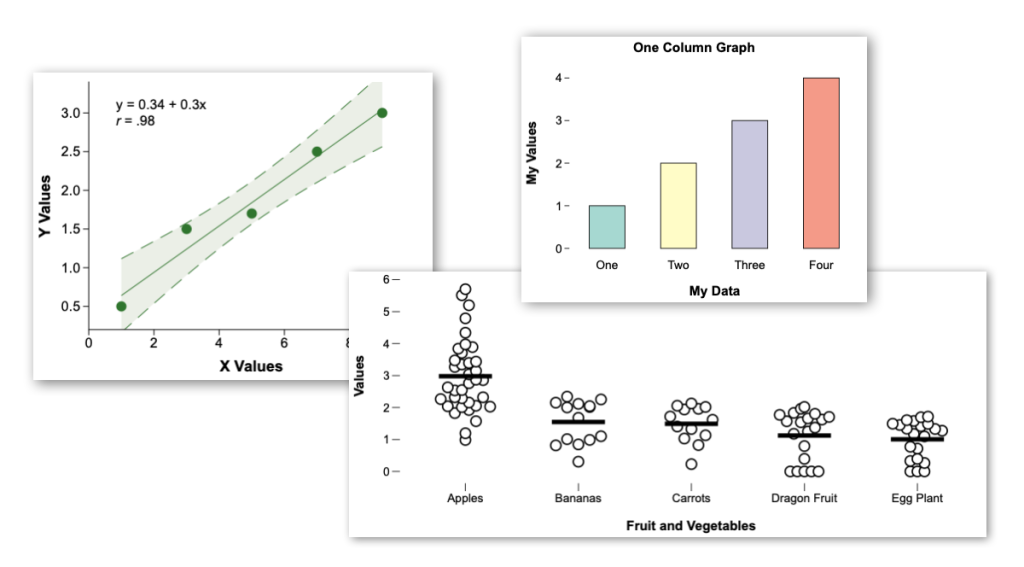
Now, you have even more control over the look of your graph. Better support for creating modern, minimalistic graphs, as you see here.

- New option to remove Box outline in the Style settings.
- More options are accessible from the graph context menu.
- More options for Bar Patterns in Bars and Pivot Commands.
Improvements
- The Connect command has a new custom icon.
- The Lines command now allows you to specify a single label.
- The Box command has an improved Points option. With it, you can now control the maximum width for large datasets.
- The Fit command now outputs the Pearson Correlation Coefficient (r) for the Linear fit option.
- The Scalar field has been optimized to draw faster.
Fixed
- Addressed an issue when you have a plot with thousands of points and use the smooth option and increase the line width to more than 1 pixel on the screen, which causes the system rendering to be very slow.
- Fixed a crashing bug in the arbitrary fit function. Happened with the tanh() function.
