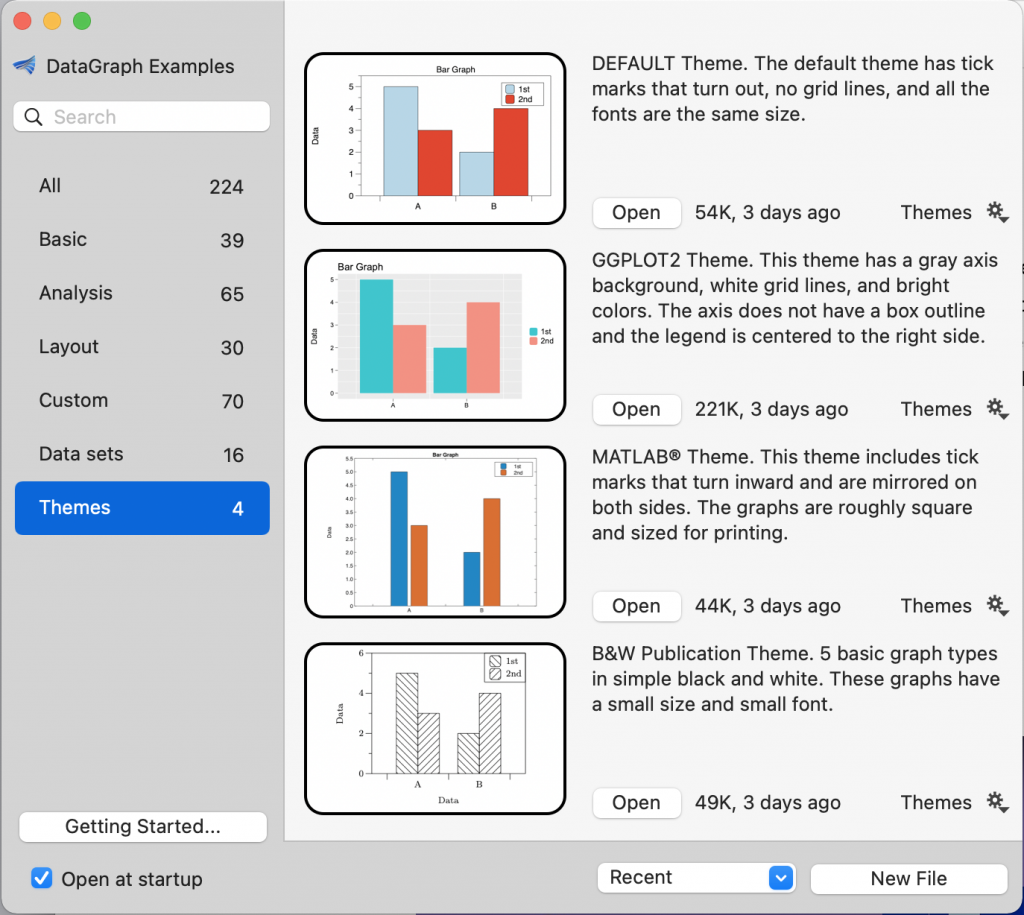
Learn how to create a custom graph theme. DataGraph has a style sheet approach that lets you separate the graph options from the style of a graph. Customize colors, backgrounds, gridlines, tickmarks, and more to create your themes. Create styles and themes that can be appiled to new graphs and moved between files. This webinar will feature examples from DataGraph’s new ‘Themes’ example files.

Video
0:00 Introduction
0:49 One thing you must know! Copy and Paste Styles
2:49 Apply Styles to Multiple Graphs
4:28 Three things Great about DG Styles
8:20 Overview of Layout settings
15:15 Q&A How to make templates?
18:31 Overview of Canvas
20:22 Graph Themes, font and sizing
27:50 Q&A How to fix axis points?
32:06 How to Edit Line& Fill Colors
37:30 How to Set Background Colors
38:06 How to Set Gridlines
41:22 Using Extra Axis Command
47:20 Q&A How to create a broken axis?
Style settings
| OPTION | DEFAULT | GGPLOT2 | MATLAB® | B&W |
|---|---|---|---|---|
| Main font | Helvetica 12 | Arial 11 | Helvetica 14 | LaTeX/Roman 8 |
| Font Scaling | – | Axis Font: -17% | – | Axis Font: -23% |
| Colors | Qualitative ColorBrewer | 6 Hue Pallet GGPLOT2 | RGB Triplet MathWorks.com | Black & White |
| Error Color | red | black | black | black |
| Box Style | One Box | Only Axis | Axis Box | Axis Box |
| Grid | – | x & y | – | – |
| Grid Line Style | – | Solid, White, width=pen | – | – |
| Minor Grid | – | x & y | – | – |
| Minor Grid Style | – | Solid, White, width=pen/2 | – | – |
| Tick marks | Outside | Outside | Inside | Outside |
| Tick mark Size | Medium | Small | Medium | Medium |
| Minor Tick marks | On | – | – | On |
| Mirrored | – | – | On | – |
The GGPLOT2 color hex codes were obtained by running the following code in R.
library(scales)
show_col(hue_pal()(6))
HEX CODES: #00BFC4, #F8766D, #619CFF, #B79F00, #F564E3, #00BA38
Canvas settings
| OPTION | DEFAULT | GGPLOT2 | MATLAB® | B&W |
|---|---|---|---|---|
| Size | 5in,3in | 5in,3in | 8in,6in | 2.5in,2in |
| Title Position | Axis Center | Axis Left | Axis Center | None |
| Title Font | Main font | Main font Scaled +30% | Main font Bold | – |
| Axis Background | – | #E6E6E6 | – | – |
| Grid | None | Major | None | None |
Axis settings
| OPTION | DEFAULT | GGPLOT2 | MATLAB® | B&W |
|---|---|---|---|---|
| Size | 5in,3in | 5in,3in | 8in,6in | 2.5in,2in |
| Title Position | Axis Center | Axis Left | Axis Center | None |
| Title Font | Main font | Main font Scaled +30% | Main font Bold | – |
| Axis Background | – | #E6E6E6 | – | – |
| Draw x/y | Yes | No | Yes | Yes |
| Extra Axis | – | X & Y | – | – |
| Drawing Style | – | No Line | – | – |
Other settings
GGPLOT2
- Axis Below Zero
- No Lines Around Fill
- Legend Center Right
MatLab
- Bar Width = 0.5
- Between Bars = 0.05
Black & White
- Fill Types set to pattern

Leave a Reply
You must be logged in to post a comment.