Interface Basics
ImageTank is designed according to the Mac user interface style guidelines whenever possible. It is however a computational visualization and programming tool, so the program also has conventions and rules that need to be learned.
ImageTank has a very different user interface compared to classical programming modules that are based on text-based programming languages where the process involves an edit–compile–execute–output process pipeline. ImageTank uses objects that control real-time computation on multiple cores. The closest program is DataGraph. If you are familiar with DataGraph some of the points below are familiar to you but some are new.
Opening Screen
When you first open ImageTank, a new blank file is opened with help notes in green. These notes provide a quick summary of the program.

The toolbar

When you start a new file you get an empty canvas for objects. The toolbar has three main areas:
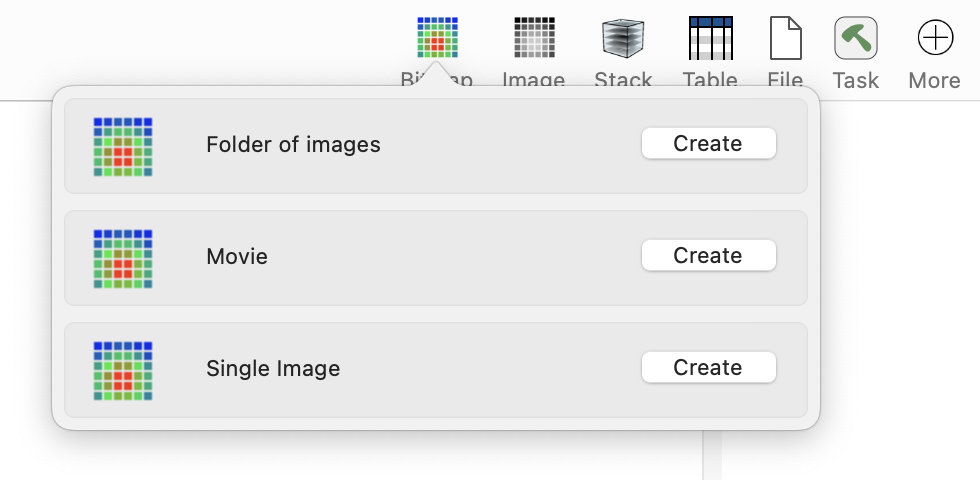
The menus to create starting points are described in the “Starting Points” section. This is typically how you pull in data. Each icon pops up a floating window that acts like a pop-up menu but contains more information.
Group button and Notes. Useful to document and structure complicated files so it is easy to understand the script if you are sharing it or need to come back to it later. This is explained in the “Arranging Objects” and “Adding Comments” sections. The group action is also accessible through the shortcut Control-⌘-G.
This is explained in the “Threaded execution” section. The short version is that ImageTank runs all computations automatically in the background and in some cases it is useful to temporarily pause them.
Starting points
This is for objects where the input is not another object from the workspace. For example, if you want to take a movie file and view it as a sequence of bitmaps the input is a path in the file system. Some of these files are automatically created when you drag a file from the finder or a URL from a web browser.
The Anatomy of an Object
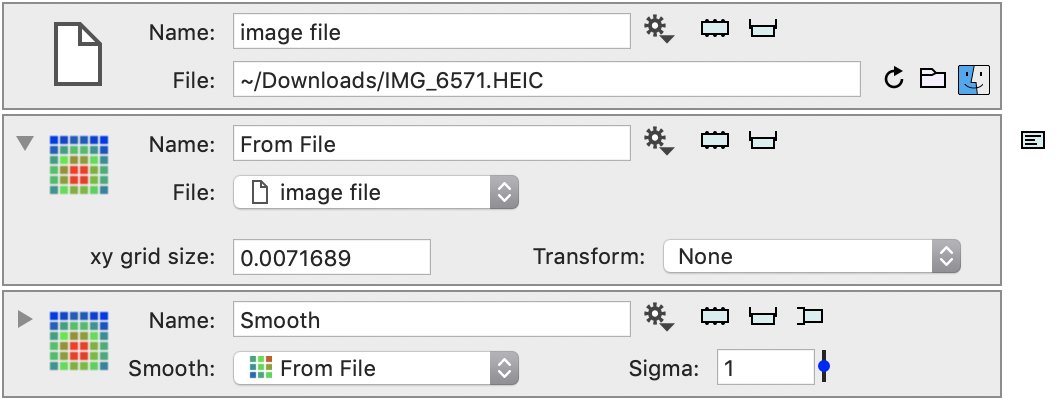
In the image above are three objects. The first one was created using a starting point and the other two using the Gear Menu. Lets dig into the various components of the UI here.
The icon in the top left indicates the type of the object and is a handy spot to click to drag the object around. The image shows the type of the object and in the above you see the same type twice even if the object is different.

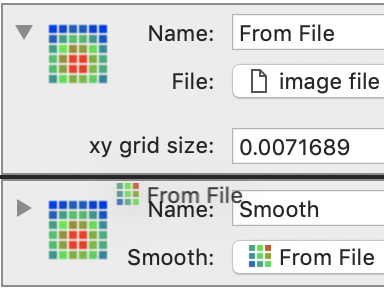
The disclosure triangle. Most objects will have further details and settings that can be shown or hidden by using this toggle. The top two lines are reserved for the name of the object and a one line with either a description or settings that are frequently used and will help you recognize what the object is computing without having to open the disclosure triangle.
The name is really a place for you to write a quick description of the object. When an object is used in another object the connection is made to the object and not the name. You can change this at any time without breaking your “code”. The names don’t have to be unique and can have spaces, unicode characters etc.

The Gear Menu. A key part of building pipelines. Will be described in a later section. This menu will be different for each variable type and might even differ based on the object type. This also contains a link to the help document for the object and variable type.

The caching button. ImageTank scales up to very large data sets and the key to that is the caching mechanism. Use this to see how much is cached for this object, and adjust the caching rule.

The Variable Monitor. This allows you to inspect the content of the object. Useful to understand the action of each object and do a quick visualization/exploration. This is not intended as the final graphic.

The Side Panel. Not every object has this button. This is a place for further user interface and often allows you to interact more graphically with the action.

The Note popup. A quick way to write comments for the object. Follows the object and you can see the content by clicking on the comment or hover over it to see a tool tip.
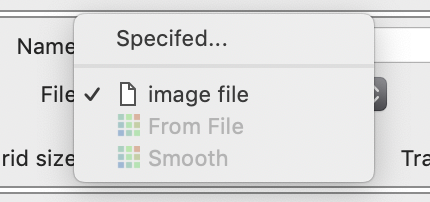
Object selector. The way you connect an object as an input. You can select the object from the menu or use any of the shortcuts. Drag an object onto this menu to select the entry, control-click to only select between entries that are valid selection (not gray) or command click on a menu to drag the selection over to another object selector. The connection is to the object and not the name, so if you change the name the menu will immediately reflect that.
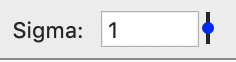
The controls are very standard Mac controls, menus, text fields and numerical fields. One key addition that DataGraph introduced and ImageTank uses is the pop-up-slider and is shown in many numerical fields. Click on the blue dot to the right of the field and change the value interactively. Since everything is computed immediately you will see the effect in real time.
Adding Comments
There are two ways to add notes. The first is by using the “Add Note” entry in the Gear Menu.
Pops up a floating window where you can edit the note. You can not modify the font, but you can include web links and multiple lines. If you delete everything and close the window the note goes away, otherwise it leaves a small button there to indicate that there is a note attached to this object. You can hover over the note to see the content in a tool tip.
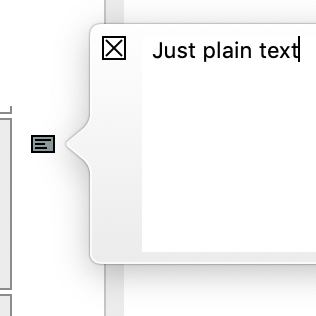
The second is to use the Note button in the tool bar.
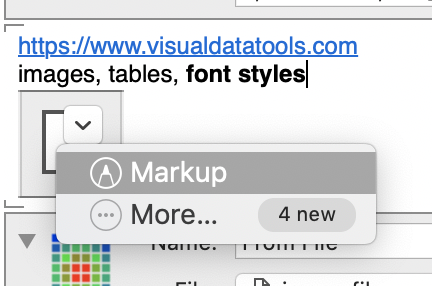
This creates a special Note object that you can drag around. It is a little tricky to drag it because you have to click on the boundary of the note. For example click on the top left corner, the small gray angle. This is full text context where you can paste in images, change the font style and even show a ruler to set up tabs etc. This is the same functionality as you can find in TextEdit so you can even mark up your images.
Gear Menu
A key part of the user interface. This is where you create additional objects, check how they are connected and go to the relevant help pages on the community board.
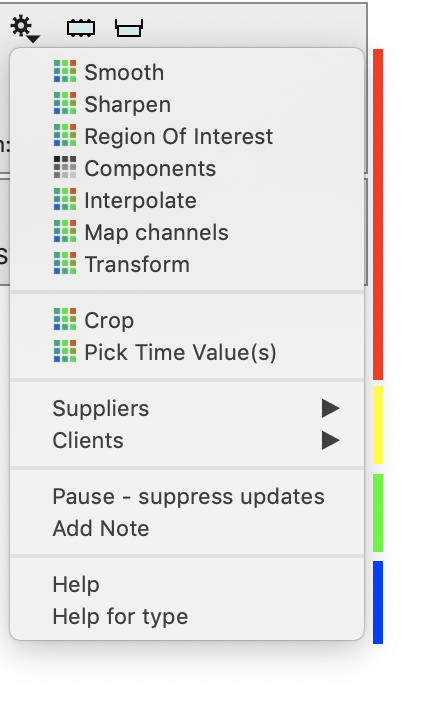
Red: This is different for each type. The image icon shows you what variable type will be created and the name gives a short description of what this object will do. When you select this a new object is created and it is connected to this object. You can change it later.
Yellow: The objects in ImageTank form what is called a Directed Acylic Graph. They are not displayed like a flow chart, but these menus allow you to travel up and down the graph.
Green: Pause works on this object alone. Compare that with the pause button in the toolbar that pauses all objects. This is explained further in the “Threaded Execution” section.
Blue: The first entry is help for this object, the second entry is help with the variable type.
Arranging Objects
The order of the objects doesn’t matter wrt computing the result. This means that you typically order them in the way that makes sense to understand the structure. That will often be in the order that they are computed, but you might want to put the details in a group below the main steps and close that group when you don’t need them.
You drag the objects around the list using the mouse. You start this by clicking outside of a standard interface element such as a button or a menu, hold down the mouse and drag it. When you drag it around the list you see a black line where they will be added if you release the mouse. Note that if you hold down the option key during the drag the selection will be cloned, otherwise moved. If you start a drag accidentally, just move the mouse outside of the document window. It will not delete the objects.
If you click in the background outside of the object and drag you get a selection rectangle. This will allow you to select multiple entries at the same time. You can also hold down the shift key and click on the image icon to add that object to the selection. Then click and drag one of the variables to drag the entire group. Holding down the option key does the same thing as for a single object clones it.The clone action will keep internal links between the entries that are cloned.
If you select one or more entries you can embed them in a group. To create the group either click the Group icon in the toolbar or use the keyboard shortcut control-command-G. You can then close this group to reduce the visual space that it takes. This does not affect the computation.
Finally you can delete an object by selecting one or more of them and hit the delete key on the keyboard. If you didn’t mean to do that you can always hit command-Z to undo the action.
Variable Monitor
The variable monitor is the quickest way to view the content of a variable. In a typical programming language you write the code and add in additional code to display it just to see the steps. If you then don’t want to see it you need to delete or comment out that code. You can also run the code in the debugger and inspect the variable. Typically debuggers only have inspectors for simple data structures.
In ImageTank the line between programming and running is blurred. Simply put ImageTank performs calculations when and only when you need the result. So opening up a variable monitor will trigger the computation because you asked for the result.
The variable monitors depend on the type of the object. They are always the same for the given type. They show a standard view and allow you more details. Typically they focus on a visual representation of the object but many will also give you a view of the underlying numerical data. This is particulary useful if you are writing external programs.
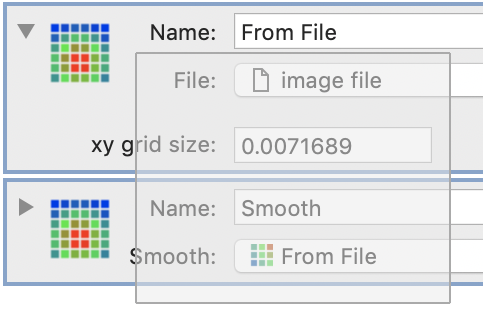
You toggle the variable monitor by using the variable monitor button to the right of the gear menu. When the detail and variable monitors are open the object can take up a fair amount of vertical space. You can go back by clicking the variable monitor and disclosure triangle but for many variables this can get tedious. To help use the Command-K shortcut. That collapses the objects you have selected down to the most compact form.
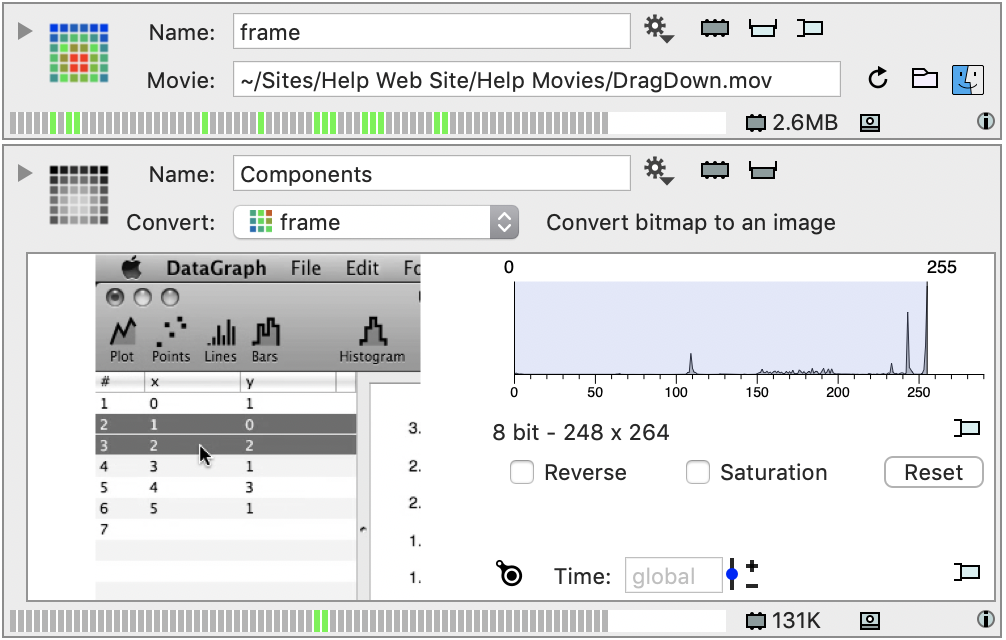
Coloring Fields
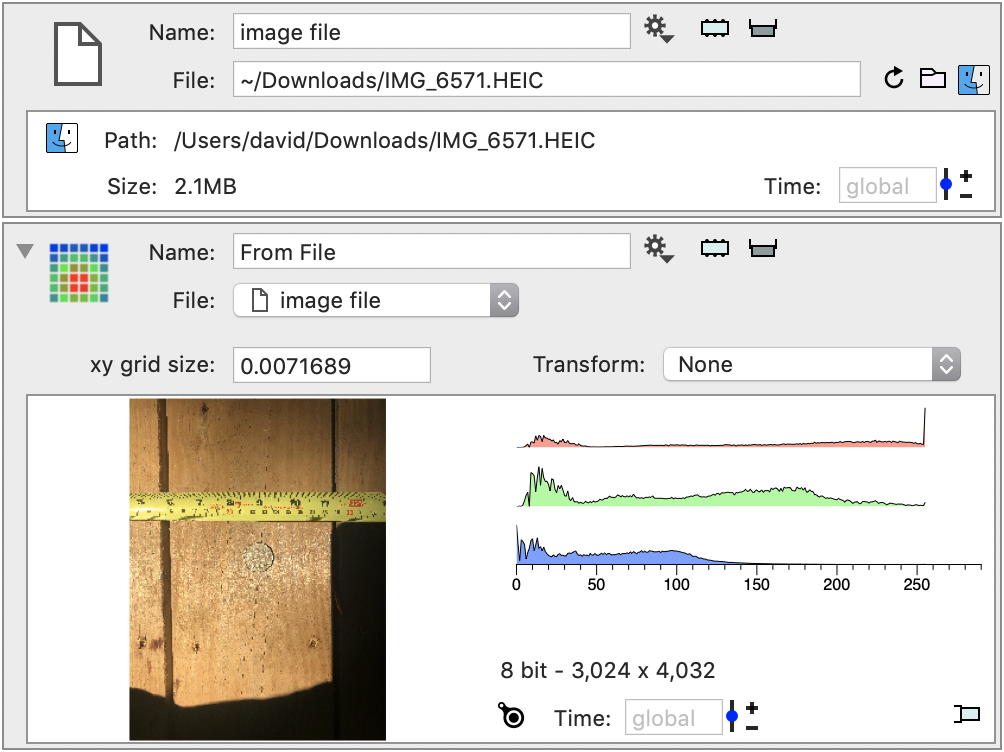
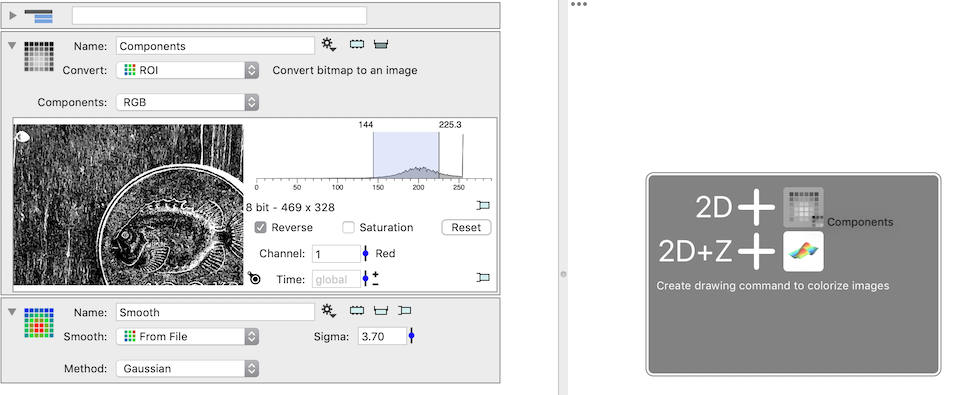
Several variable types consist of a field of numerical values. When you draw this value you need to colorize it. There is a common method used in variable monitors and several drawing commands, and an example is shown below.
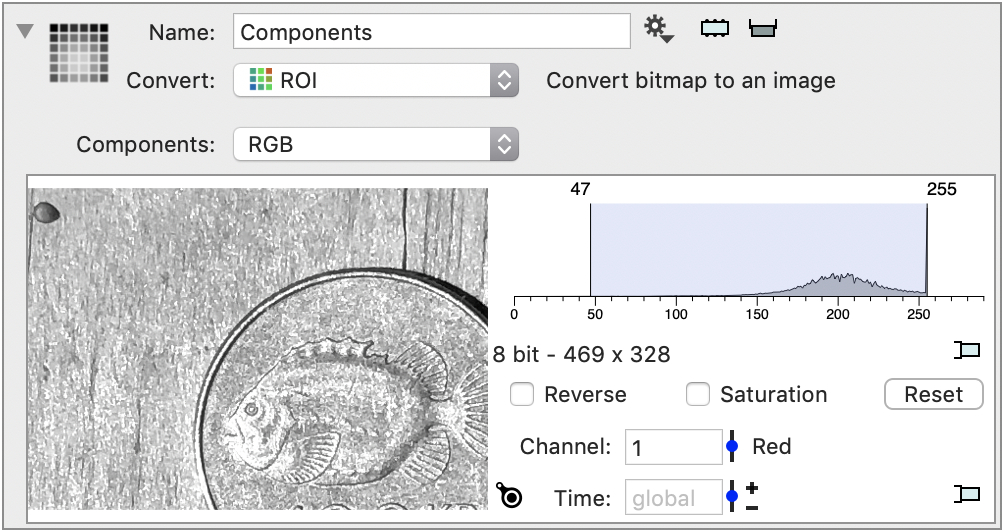
Look at the histogram on the right. The default method is to find the largest and smallest value and draw the lowest value black and the highest white (fully saturated). You can however adjust this interactively by clicking on the edge of the blue region and drag it around.
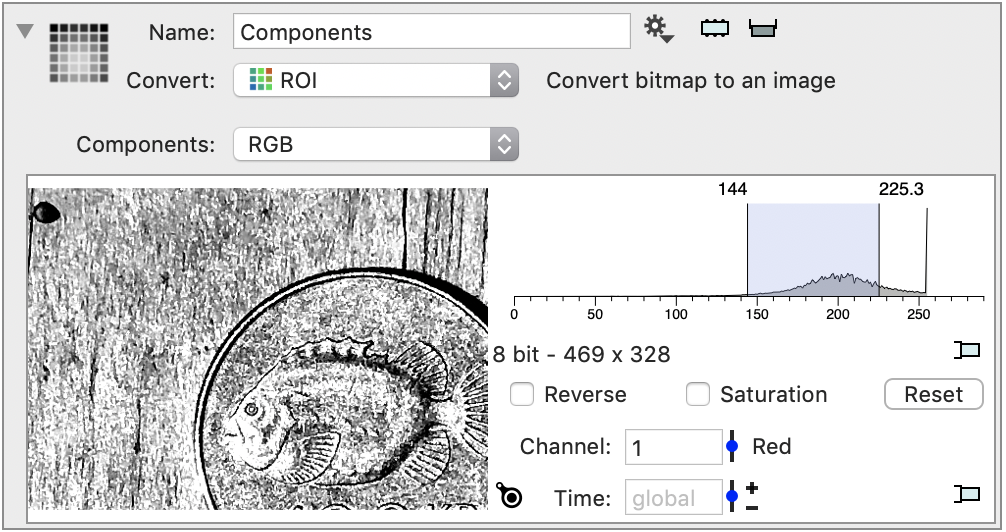
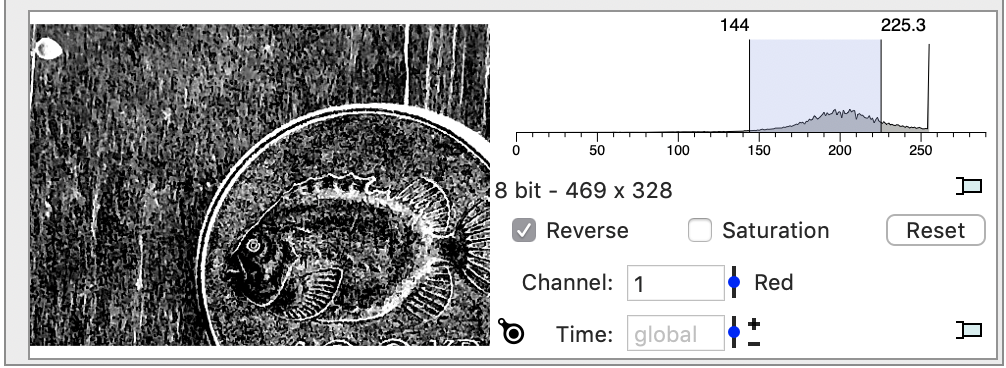
This changes the method from always using the minimum and maximum of the range and switches to selecting the range you specified interactively. Hit the Reset button to go back to the default dynamic range. You can also reverse the ramp so the minimum is white and maximum black.
The Loupe Tool
This is something that is familiar to any DataGraph user, and is used in several places in ImageTank.

This is turned on by default in many of the variable monitors and side panels. You can turn it off by clicking on the small loupe button. If there is a solid point it is automatic, a white interior means that is no enabled. You can pinch and zoom to change the size of the source and destination area. Normal pinch and zoom on the trackpad changes the larger/destination circle and if you hold down the control key you change the smaller/source circle.
Side Panel
Many actions in ImageTank have parameters that really have to be tweaked interactively. That requires you to set up some kind of a visual representation to see the result and then explore the parameter space. Certainly ImageTank is good at setting those up relatively quickly, but in many cases it is pretty predictable what kind of visualization you need for the exploration. For those cases many objects have a method to expand the space for the GUI elements as well as give you a live feedback of the result or even internal comptuations.
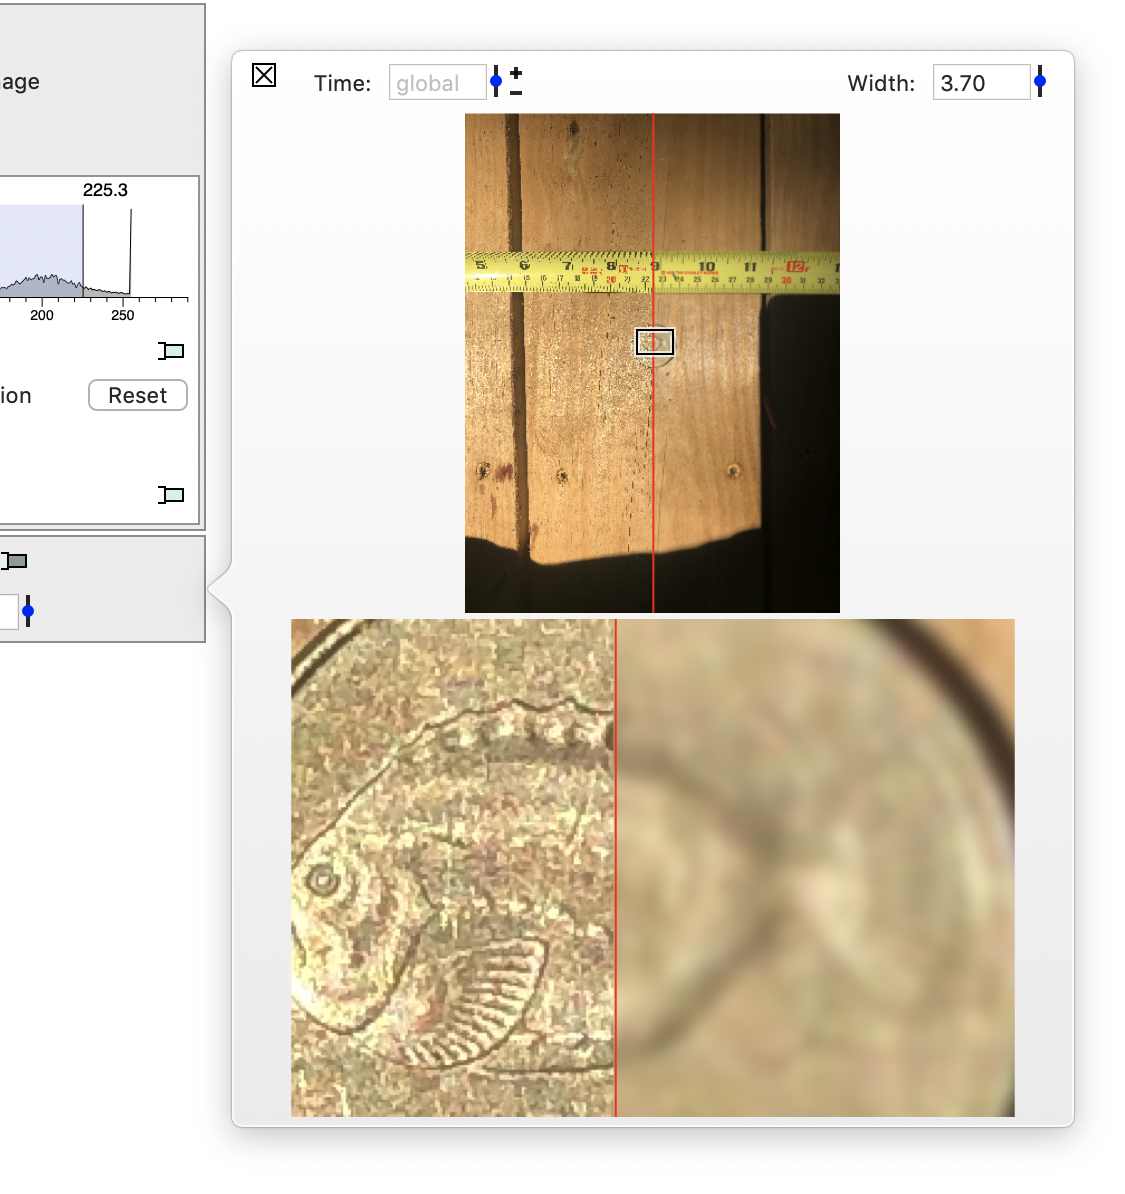
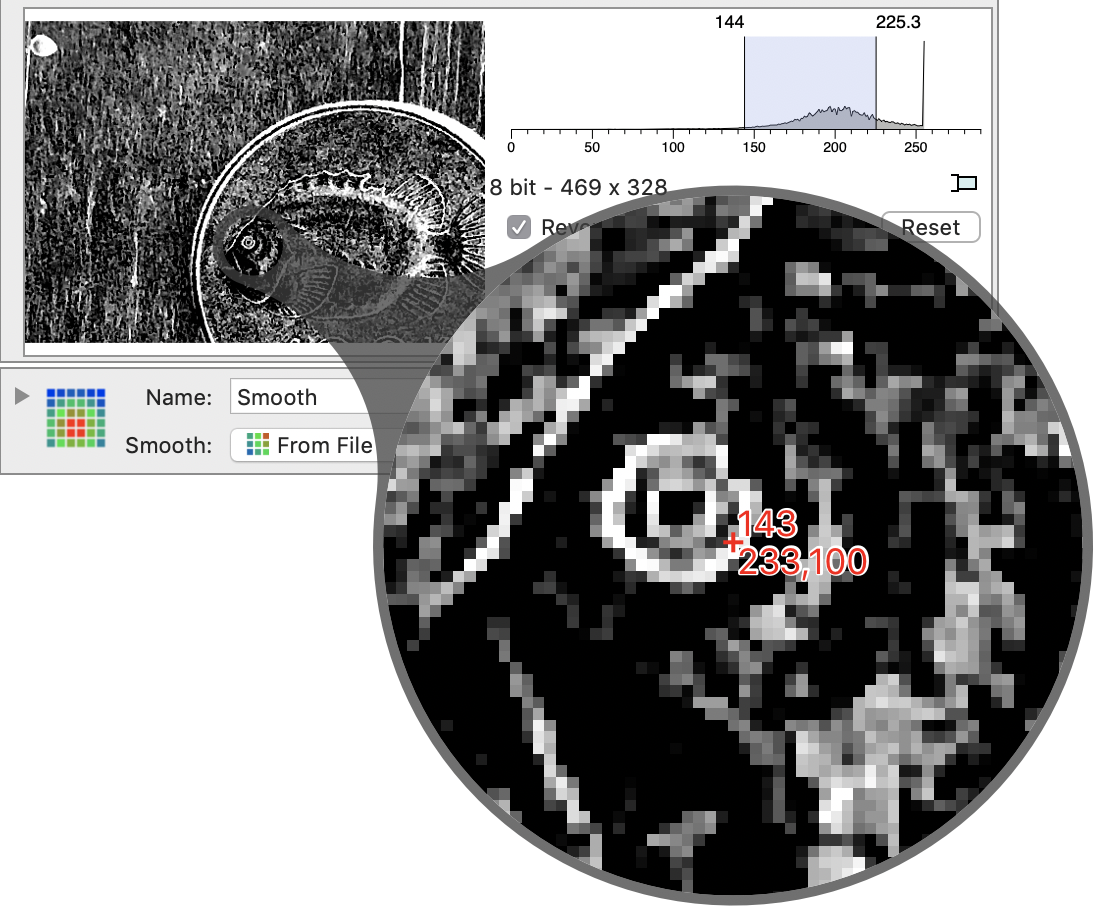
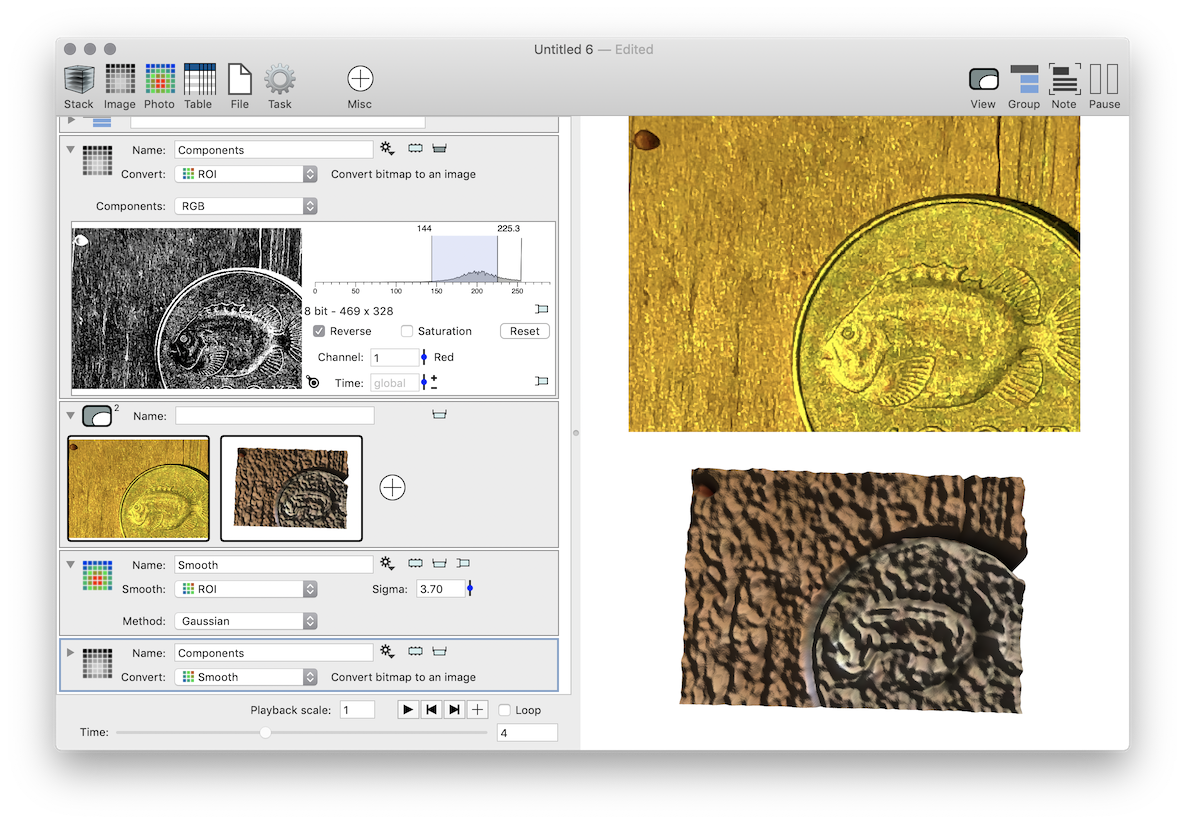
These side panels are explained in the help document for the computational action, but to give some sense of what it can do, consider the example of a smoothing operation where you don’t know beforehand what kernel size would be needed.
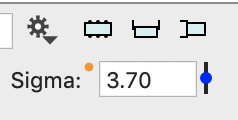
The standard UI doesn’t have a lot of information
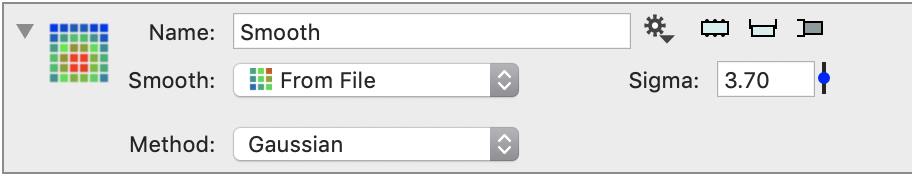
You can specify the radius of the gaussian in pixels and that is it. However the side panel will use the current time value and apply the smoothing operation to that image. The side panel also allows you to zoom in on a detail of the image and slide a red vertical line across the image to see the original image on the left and smooth image on the right. This allows you quickly see what is needed.
The Group
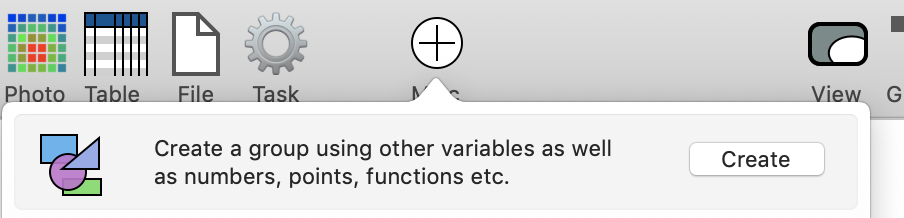
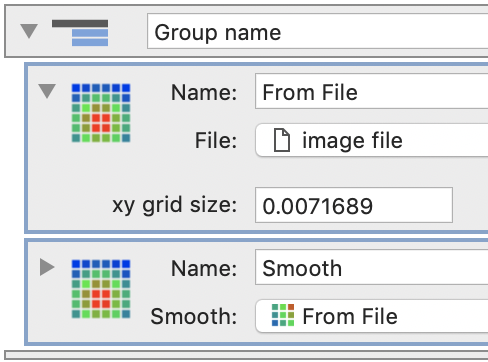
The Group variable serves a very important function in ImageTank, so even if this document doesn’t go into the list of variable types defined it is important to mention it here. In the simplest case you can create a group from the tool bar. This allows you to have named variables in a structure.
If you look at the list above there are two types of variables. At the top are variables that can only exist inside a group. That is, they can’t have an object with a monitor. This is done to simplify the user interface and also because these objects rarely stand alone. When you compute a fit for example you get the function, parameters and quality fo the fit. This is a cluster of values. And as is explained in the next section you can easily reference those values from the group in other objects.
In the lower part of the list are variables that are computed with stand alone objects and they can be included in a group. In fact you can have a group within a group.
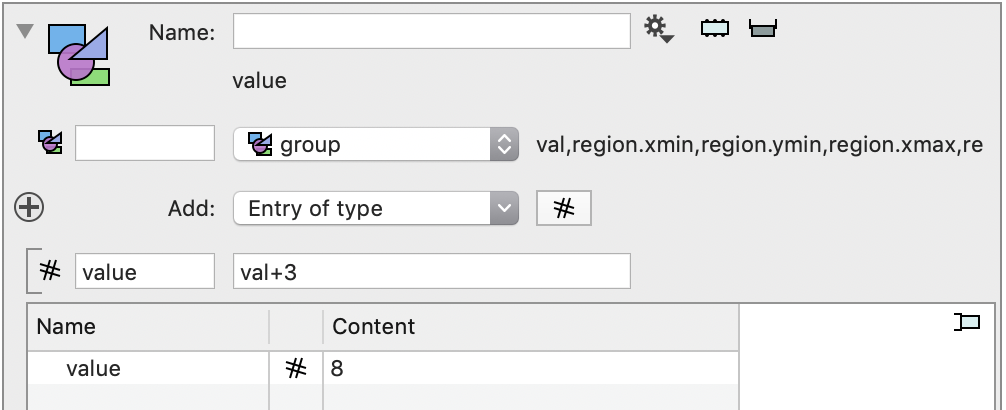
In the below example is a group that contains a number and two regions. One region is specified using an expression, the other by referencing an existing object.
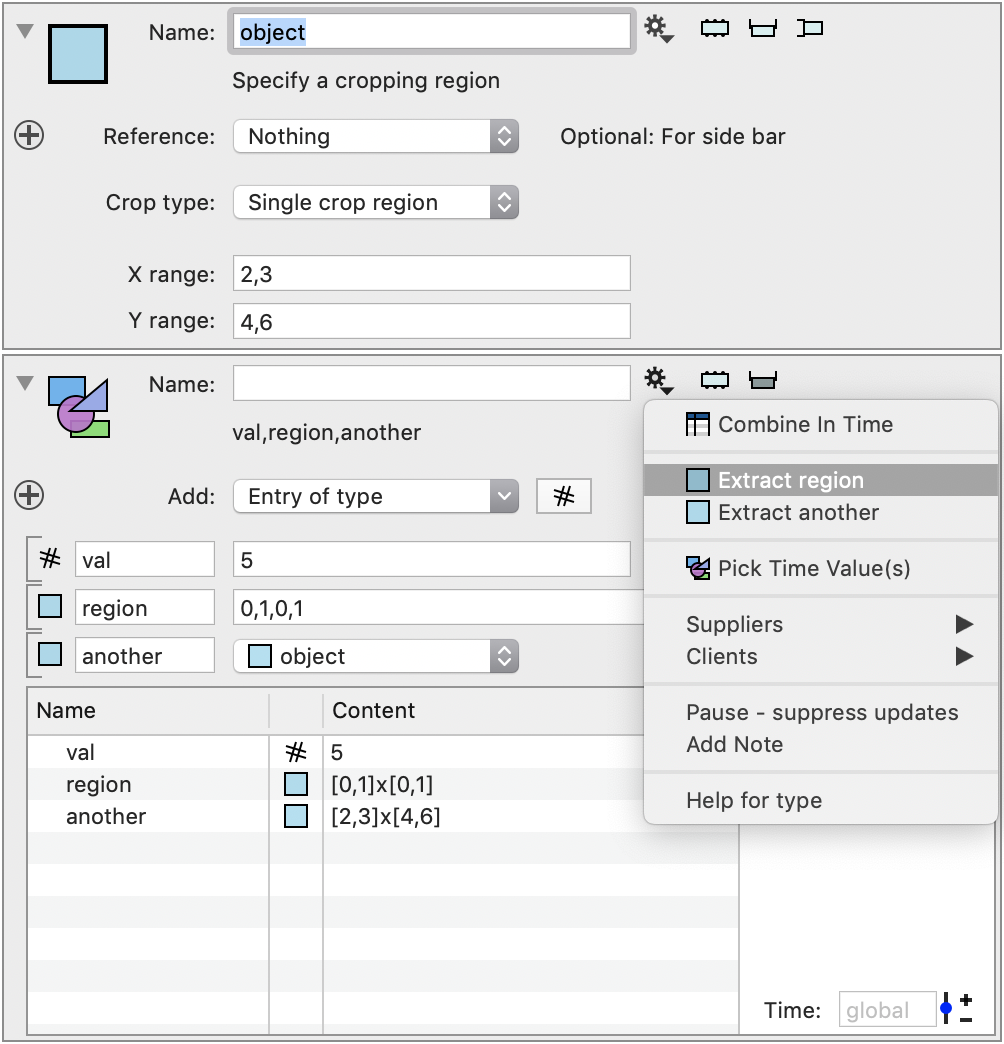
The Gear Menu has a method to extract the region entries out as stand alone functions, the number can not be.
Local Variables
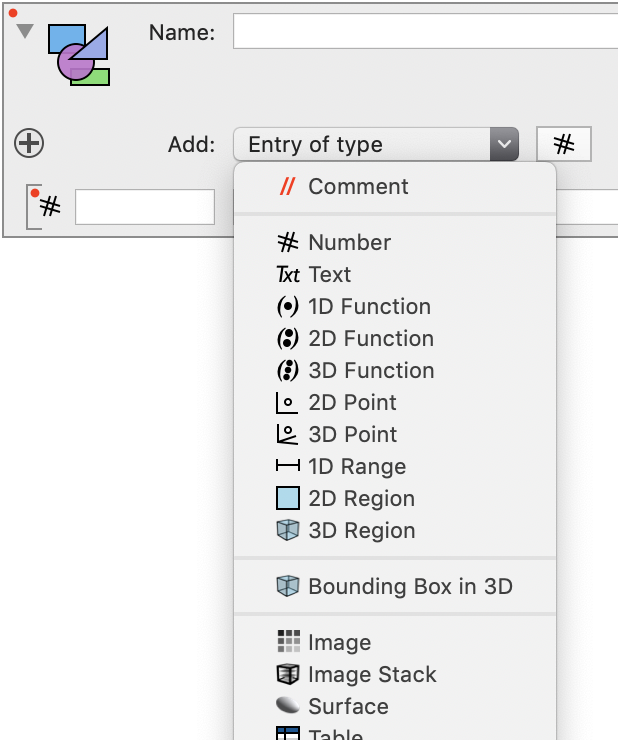
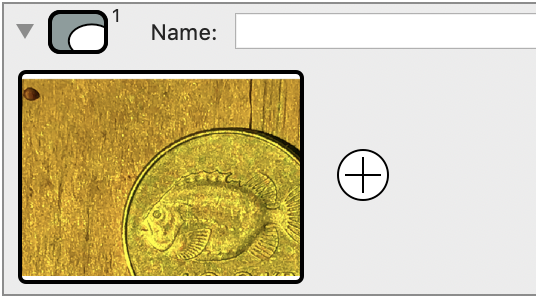
If you create an empty group you get the following entry.
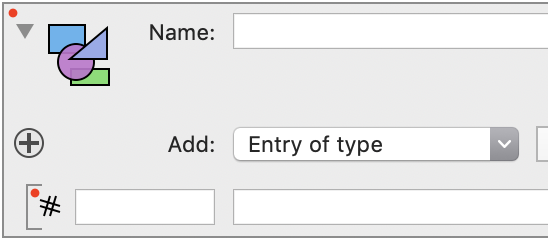
Focus on the small + icon just below the icon

This is used to add local variables. This is used to address an otherwise challenging problem. The objects give you a representation for “large” data, but what about all the parameters that you want to depend on computed data as well. Things like what contour value to use, result of a non-linear fit, the maximum and/or minimum of a numerical field. This is what you can do using local variables. The first step is to add a local variable by using the + button.
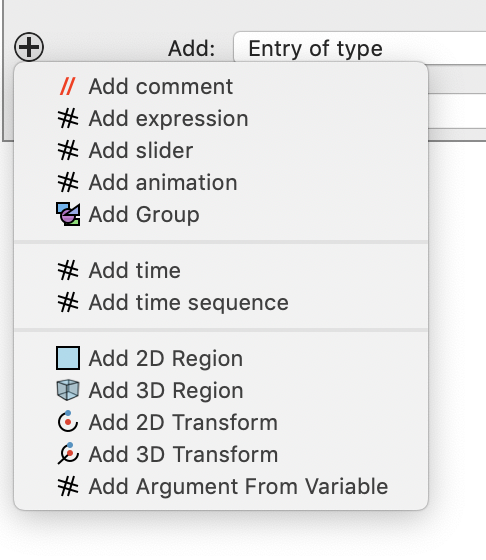
Select “Add Group” and select a group object.
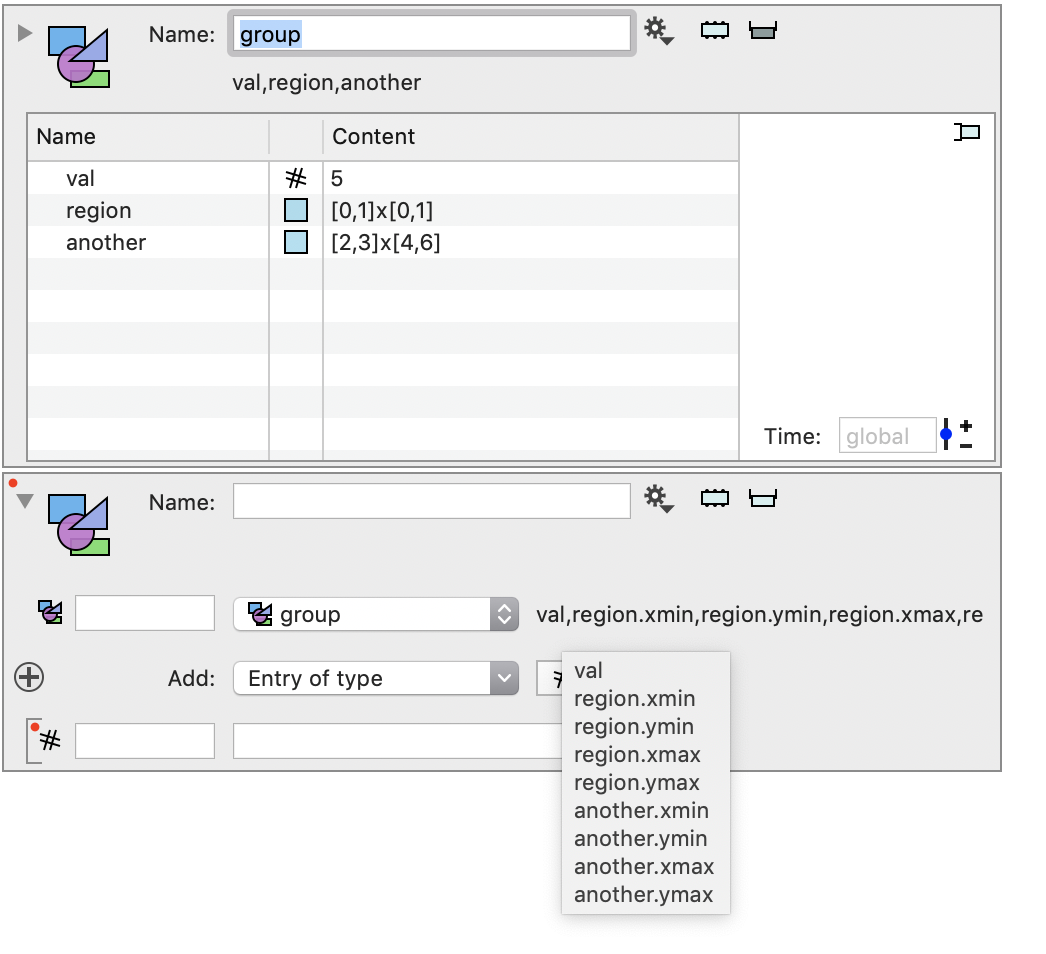
This has added the values from the group as local variables inside this object. That means that you can use them in an expression
You can add a number of different lines, sliders,.. See the page for local variables for more details.
Concept of Time
A movie is viewed by ImageTank as a time dependent bitmap and therefore looks like a single bitmap in terms of the object UI. If you click on the cache button you will see the time values at the bottom of the view.
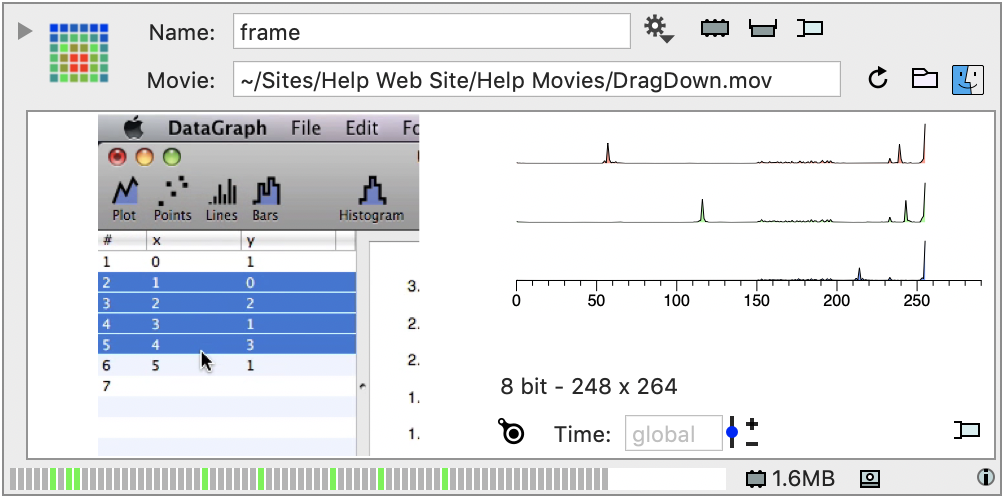
ImageTank treats this as a sequence of images labeled by the time value. For a movie that is the time step in the movie, but if you have a folder that by default has time values 0,1,2,3,… and is a time sequence of files. If you use this object in another object that object will also depend on time
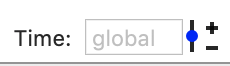
You interact with this time value in various ways. At the bottom of the ImageTank window is a slider called “Time”. This allows you to go through the time values using the slider, by clicking on the backward/forward buttons, animate in time by hitting the play button and toggle between two adjacent time values by using the + button (toggles between + and -).
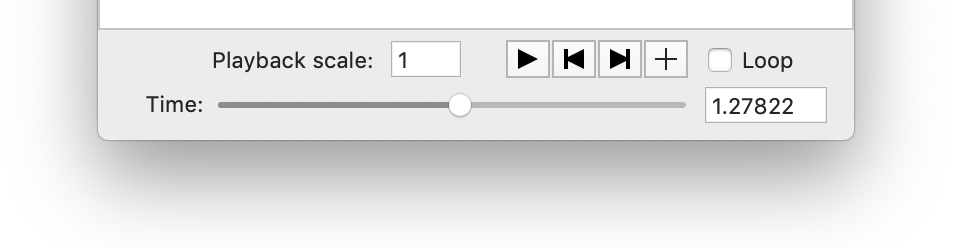
This determines the global time. This is the time displayed in the figures and in the variable monitor/side panel if it says global in gray
You can specify a different time value here if you want to look at other time values without forcing everything to be redrawn.
Caching
ImageTank uses several tricks to speed execution and stay inside a given memory budget. This is done with the following methods
- Lazy evaluation approach of waiting to compute until it needs the result.
- Caching computed values in memory
- Storing results on disk if memory gets tight
- Clearing the computed result and automatically recompute it if needed
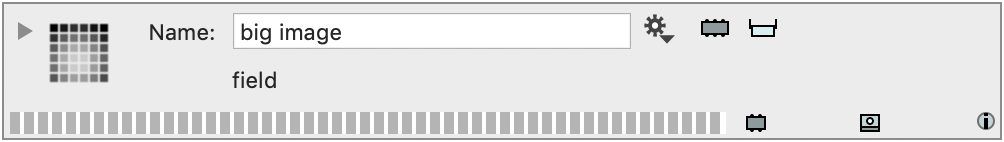
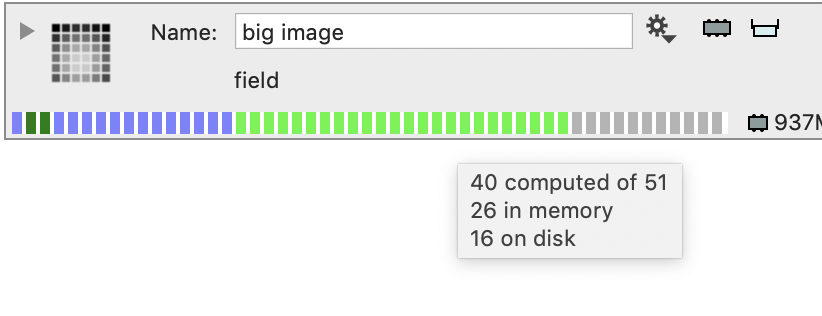
To see the cache status click on the cache button next to the Gear Menu

What you will see is the status of the cache. If nothing is in it everything is light gray
If you click on the small i button in the lower right corner you see the cache setup
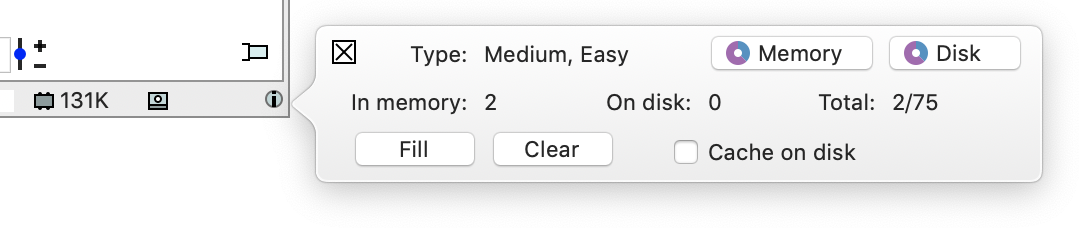
Click on the Memory or Disk buttons to see the global settings for the cache sizes.
If you check the “Cache on disk” it will go through the following
- Bright green means that the object is in memory
- Blue means that it is only on disk, not in memory
- Blue green means that it is both on disk and in memory.
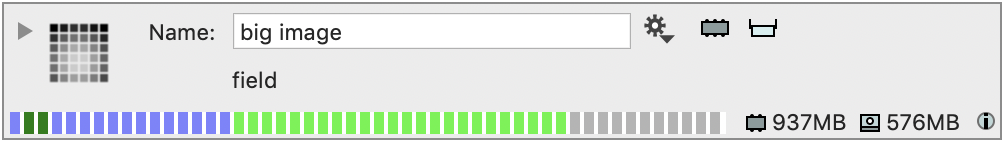
If you hover over the cache bar you see more information about the exact number.
The Drawing Canvas
When you widen the window you see a split with the objects on the left and a blank white area on the right. This is the drawing canvas. The simplest way to draw an object in that canvas is to drag it over the blank area. A floating window will pop up over the middle of the area and present you with options. For the image there are two different drawing representation available. One is a standard 2D spatial graphic the other is a 3D graphic with x,y spatial and z from the value. You also see an icon for the drawing command that you can create. For some objects like the Table object you will see a choice between drawing commands.
This creates drawing view object and draws that in the window
The first one will fill the entire drawing canvas. You can split the canvas horizontally and vertically. If you go to the top left corner of the figure you get a floating window with controls.
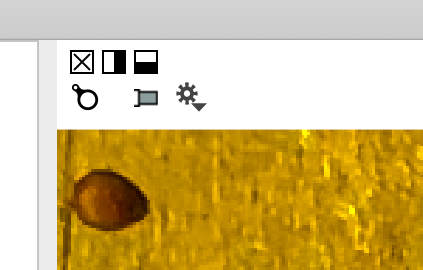
The controls, going from left to right top to bottom are
- Remove this from the canvas. Does not remove the graphic, just won’t show it in the canvas.
- Split the current figure into side by side graphics
- Split the current figure into top/bottom graphics
- Loupe Tool
- Side panel to show the underlying drawing commands
- Gear Menu
This allows you to split the canvas into two parts and draw both the two and three dimensional graphics.
Threaded Execution
ImageTank differs from standard programming languages in terms of how it runs computation.
- Every variable monitor runs in a separate thread
- Computation needed for a side bar runs in a separate thread
- Every figure draws in a separate thread
- Every thumbnail runs in a separate thread
- Some computations split the work into chunks and spread that only threads
What runs in the main thread is
- Drawing graphics (3D is drawn on the GPU and thus on a different thread)
- All user interface interaction
This means that the user interface stays responsive even when a time intensive computation is going on. It also means that multi-core machines are often using at well over 100% utilization, since the utilization is based on a single core measurement.
How does this affect the user experience? The main rules are
- When an object is used in a computation it can not be deleted.
- Undo and Redo are disabled. Undo actions are recorded, you just can not do Command-Z to undo them if anything is being computed.
- You can not change connection between objects, i.e. select a different object during a computation. That is however not as strict as it sounds because if an operation finishes while you are selecting a new object that will work. Same for deleting objects.
- When you change a menu entry or numerical value the change is marked as pending that is indicated by an orange dot next to the entry. This is because the selection you see is not what is currently computed. When that compuation finishes this change will be incorporated and the orange dot will vanish.
Everything else is allowed. You can add other objects, make connections elsewhere even to entries that are currently being computed. Also computations often only involve a subset of the entries. The effect is that you can continue “coding” and ImageTank will catch up with you.
Error Reporting
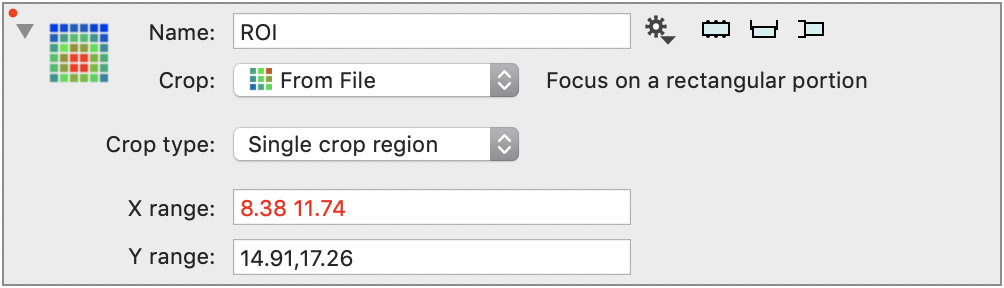
There are two types of errors that can happen. Error in setting up objects such as invalid fields, missing connections etc and run time errors.
For entry errors the entry pulls attention to itself with a red color. There is a red dot in the top left corner if there is a mistake in the object. Red dot or red text pulls your attention closer to the error.
If the objects is invalid nothing is computed, which means that objects that depend on it are also invalid.
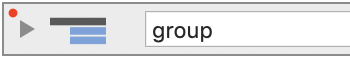
If the object is inside an object group that is closed the red dot shows up in the group as well. As soon as you open it the red dot goes away from the group.
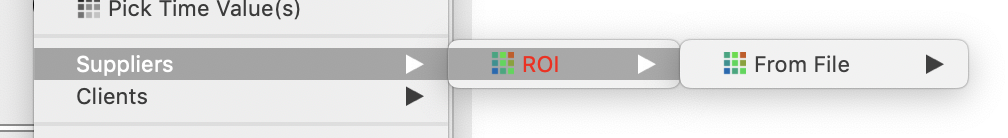
You can use the Gear Menu to find the source of the error. For example in a varible that uses ROI it is invalid but does not show a red dot because it is not the source of the error. If you go in the Supplier list for that variable the entries that are invalid (even if they are not the source) are red and you can use that to find the source of the error. Select that to fix the culprit.
Run time error reporting for a multi-threaded application that determines dynamically in what order to perform calculations is challenging. The approach done here is for each object to keep its own error log. If there is an error message you will notice a red dot blinking in the top right corner.
Click on that to get further information
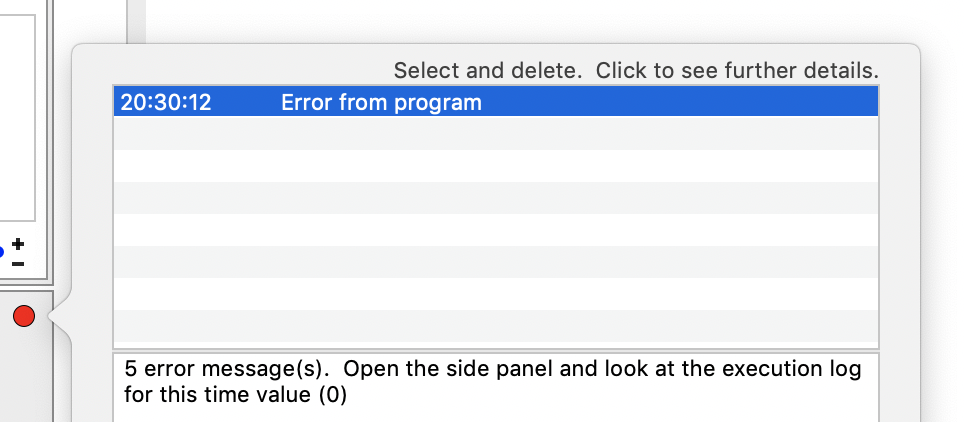
To clear the errors you can select the entries and hit the delete key or hold down the control key and click on the big red dot to clear all errors and remove the red dot.
Undo/Redo
Undo/Redo is fairly self explanatory, and ImageTank keeps track of the the undo since you opened a document. Variable monitor and side panels don’t record undo if you are not changing the state of the ImageTank file.
One consideration though is that undo/redo actions can not be performed if the file is currently computing something. That is because when ImageTank is computing it locks the variables that are involved in the computation and since an undo might affect that it is disabled until the computation is finished. The undo action is still there but can only be performed when the file is “quiet”. Note that this is on a file by file basis, so an action in one ImageTank file will not affect the undo in another.