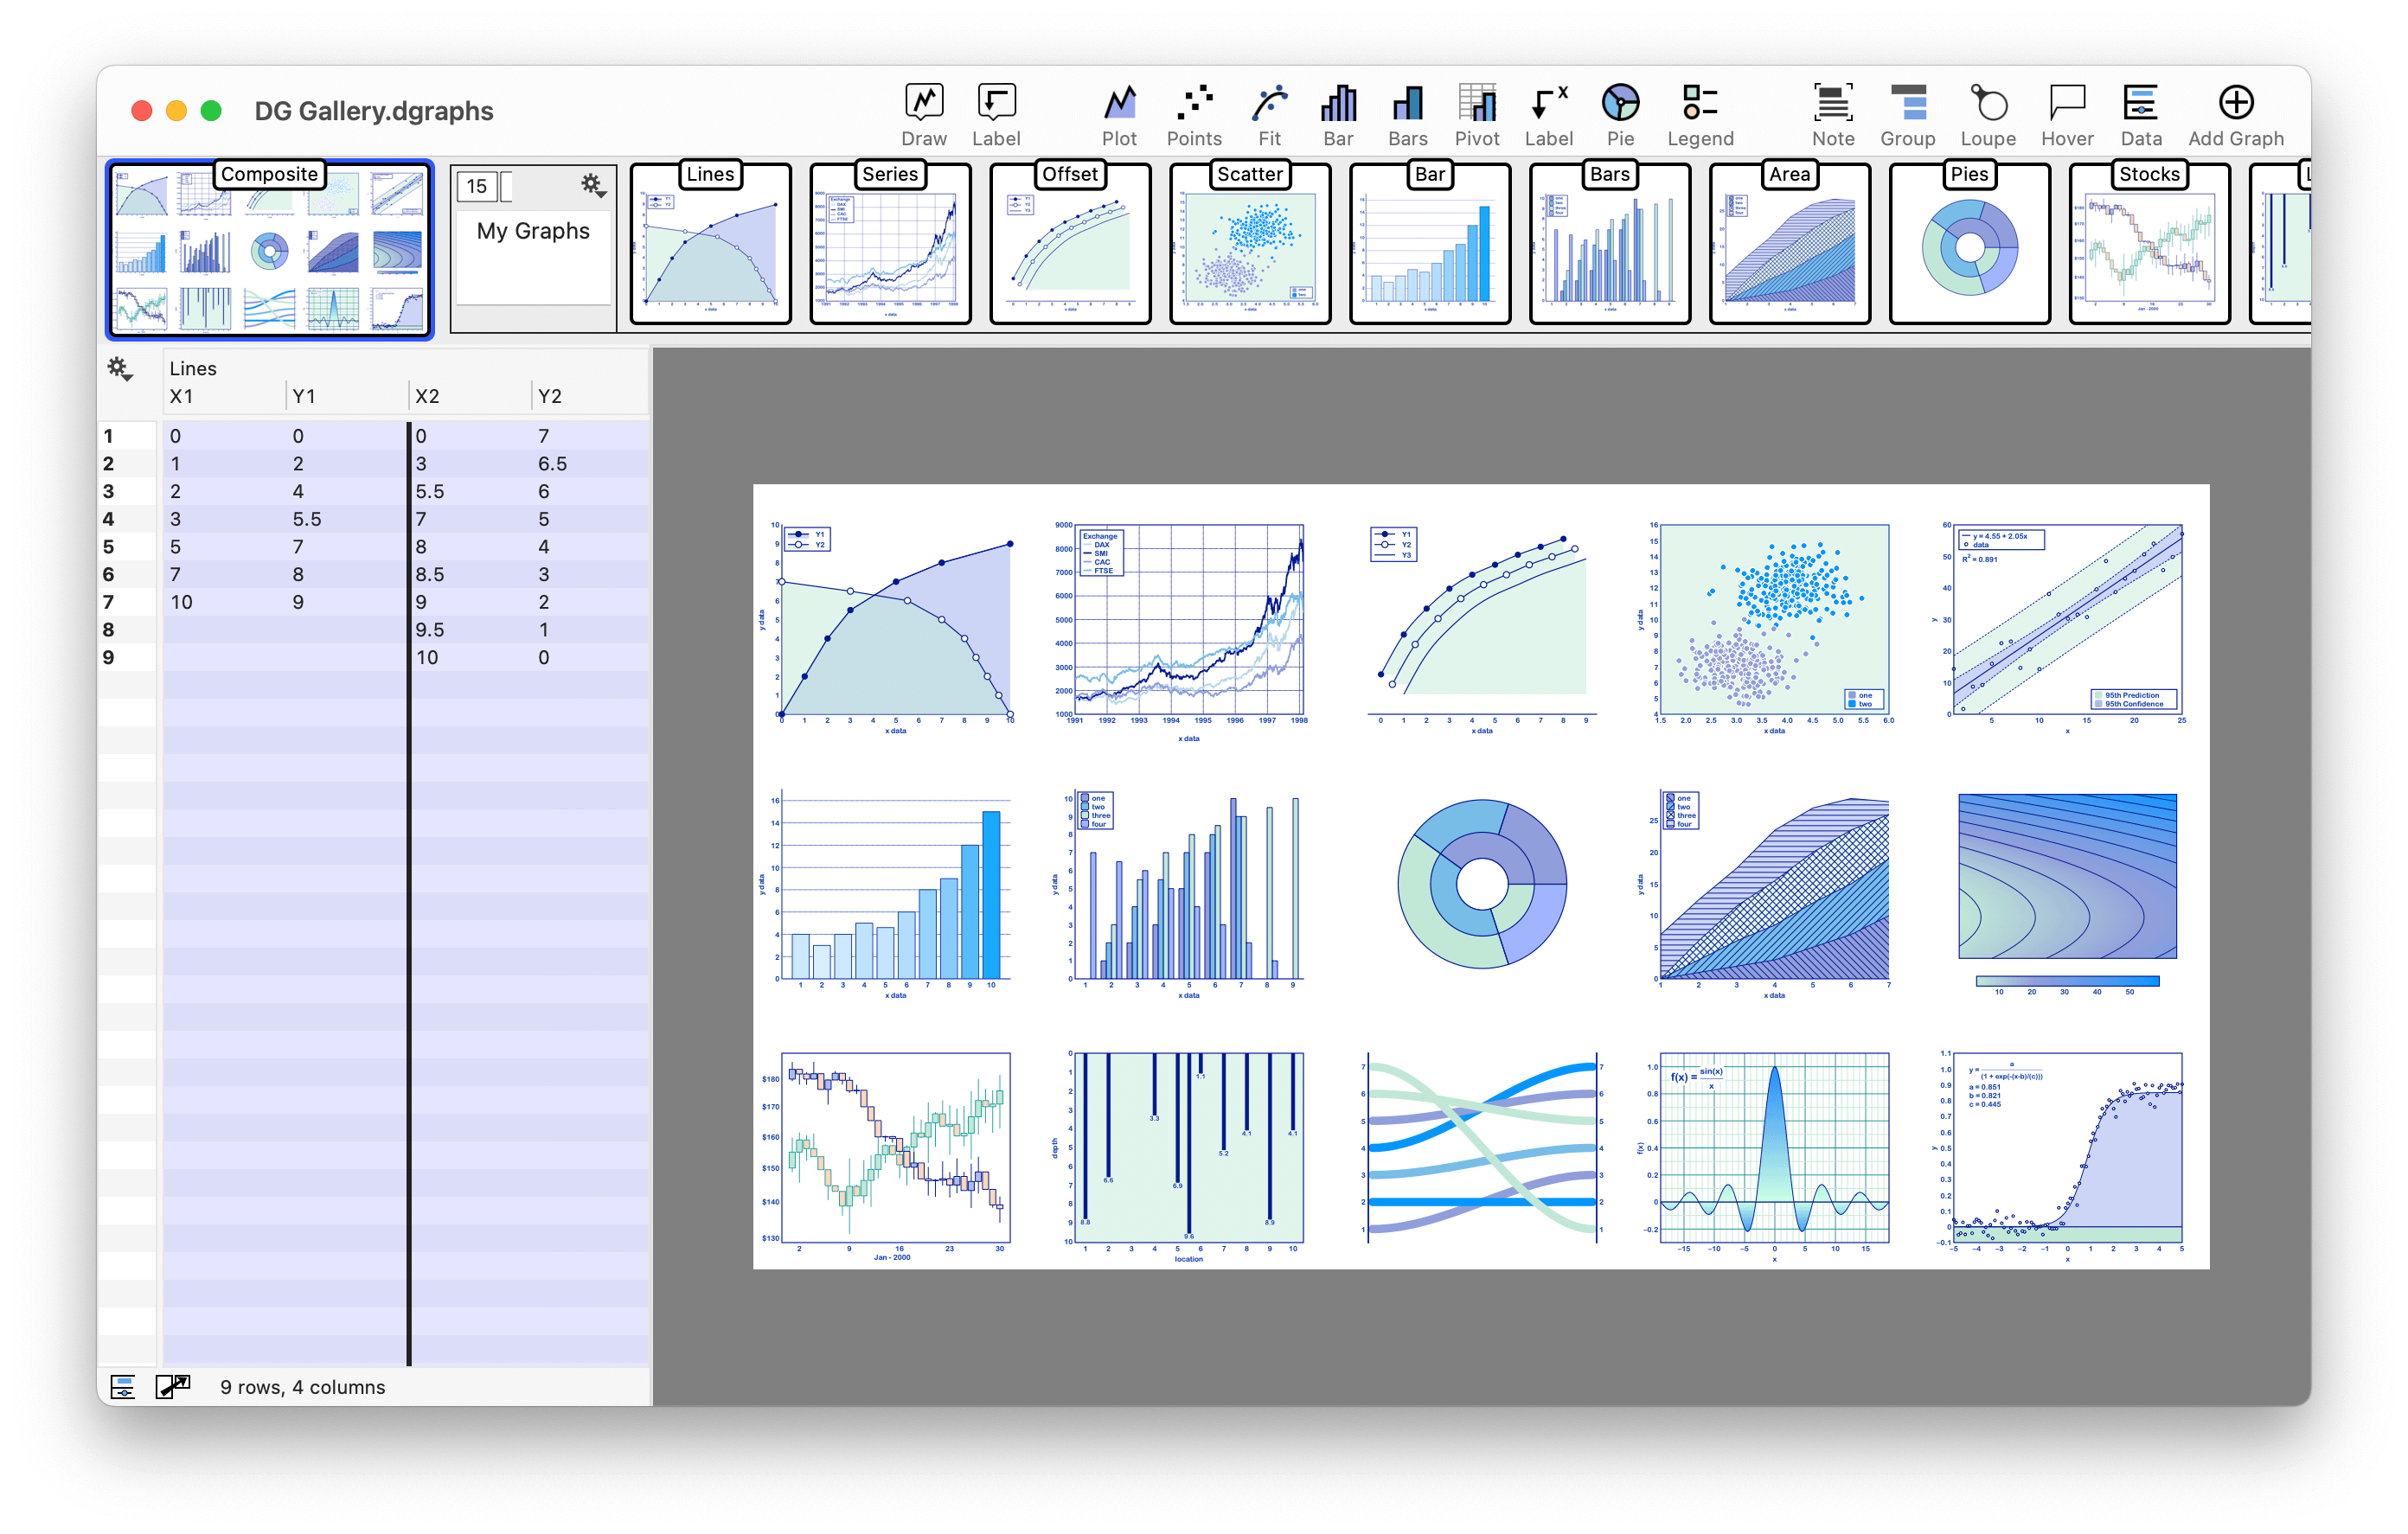
Forum Replies Created
-
David – You’re site continues to amaze me – beautifully designed graphics that are clean and clear.
In particular, “Figure 4. Cumulative rain totals at Seattle-Tacoma International Airport for yearly periods beginning on October 1” is really impressive. It looks like you have a waterfall chart layered over the time series data.
There are several other design choices that I really like. For example, the inset to the right of the graph and the axis labels for the months being a different color to offset them.
Could you explain how you are creating the x-axis for Figure 1 and 4? My first instinct is that you would have to use an Extra Axis command but I don’t think that command works for dates.
Here’s hoping you get some sunshine soon!
Wonderful array of examples! Thank you for posting.
in reply to: Some experience of using DataGraphThanks! I probably spent more time on this then I should have :). Might not be able to do this every day.
BTW – the best size for twitter is 1200 by 675.
In DataGraph, you can set the size in the Canvas settings to (1200,675). Then output the graph as a png with 72 dpi to get the exact size for twitter.
in reply to: 30DayChartChallengeTo easily plot these you would need to append the data into one column. Is there any possibility of generating the data differently so you can more easily append the data?
For example, if you have each x y set of data saved in individual CSV files where the column headings would be the same, but each file name would identify the data. If so, you can import all the data at once by dragging and dropping all the files at once onto the column list. Then each x-y pair would be in its own group.
By then placing all the groups in a higher level group, you can use the gear menu on the highest group to append all the data at once.
That creates the appended set of data that can be plotted with one Points command, where you can have the color of the point vary.
Otherwise, you would need individual Points command for each one x,y column and the colors would have to be set individually.
in reply to: Multiple x and y columnsIf you missed todays webinar, we have more sessions posted now for April. Use the same link as above!
in reply to: 10 Things Every DataGraph User Should KnowSorry – this post was not responded to earlier!
To color the lines you could:
- Use individual Plot commands for each year, OR
- Use a Plots command and use the color suggestions.
Watching this video would help explain the process:
Create Color Schemes & Multicolored Line Graphs in DataGraph
-
This reply was modified 2 years, 6 months ago by
pamela.
in reply to: Color the lines for different years in Point graphHi Charles!
Thank you so much for sharing your work. This is very different from my field, but looks like a very interesting analysis. I enjoy seeing how people are using the program!
Also very much appreciate your acknowledgment of DataGraph 🙂
in reply to: New Guy Who Uses DataGraph (For Very Simple Graphs)Hi Veronica — You have two ways you could do this.
- Apply a scaling factor to the B and D graphs.
- Create the graphs separately and use a Graphic command to combine them in the final graph.
You can find examples of each in the On-line examples. Check these out and let us know if you have any other questions or anything is unclear.
in reply to: create a graph composed by 4 graphsThe combination of the drawing and the data is very slick!
We will look at how to add a GIFs to the site. As you found out, the current uploader limits us to individual images. Posting the video on YouTube was very helpful.
in reply to: Spatial Measurement AnimationCharles,
Have you had any luck fitting these curves with a linear regression? The slope would seem to be an interesting parameter to display, but yes you can visually see that 33508 appears to be a pretty clear outlier.
in reply to: Analyzing Satellite Behavior