Misplaced labels in polar spider plot with n>12 labels

Welcome to our Forums Product Development Bug reports Misplaced labels in polar spider plot with n>12 labels

Viewing 5 posts - 1 through 5 (of 5 total)
  • Author
    Posts
  • #8242
    berry holl
    Participant

      When starting from the Online example “Spider plot is a version of polar plot”, and adding more labels, the label position is misplaced for the last label when the number of labels > 12. Here an example with 12 labels (correct label placement):

      spiderPlot12labels

      And here with 13 labels (misplaced “13” label, and it is not affected by any specified offsets):

      spiderPlot13labels

      I have been unable to correct for this so far. Any suggestions?

      #8243
      berry holl
      Participant

        Here another example that I adapted from above, where the origin is at the top and labels increase clockwise. I see the same issue with the last label, here “23”‘:

        customSpider24Labels

        #8247
        dgteam
        Moderator

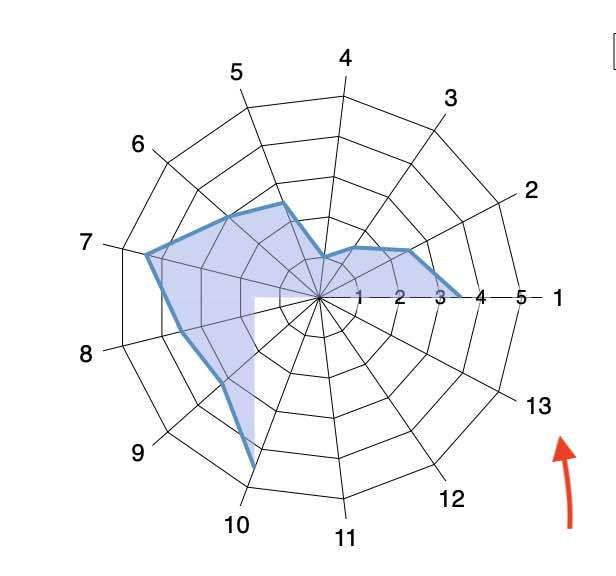
          The problem was that, even though the line was being drawn around the ring, DataGraph was treating the last label like it was the end of the line, resulting in the offset.  We will fix this in the next Beta, and soon to be out 5.0.

          For now, here is a hack… Go the column where you have the labels entered.  In the row below the last label, double click and simply enter a blank space with the space bar.

          space

          The the row with the space is treated like the end of the line and the last text entry, in this case, ’13’, is correctly located.

          Untitled

          Not sure if this will fix the second example but we think so.  The fix will be out soon so you won’t have to do this hack going forward.

          #8249
          berry holl
          Participant

            Thank you very much for the quick resolution of this problem, the beta solved it for me!
            Attached my customised version of the plot with ‘fixed’ “-15” label.

            Screen Shot 2022-01-31 at 09.39.53

            • This reply was modified 2 years, 2 months ago by berry holl. Reason: added figure to show modified version work as expected
            #8251
            dgteam
            Moderator

              WOW!  Fantastic looking graphic!

              Could you provide an explanation on what this represents?


            Viewing 5 posts - 1 through 5 (of 5 total)
            • You must be logged in to reply to this topic.

            Welcome to our Forums Product Development Bug reports Misplaced labels in polar spider plot with n>12 labels