Pivot command and Plot command is the same graph.

DataGraph Forums › Technical Support › Support Desk › Pivot command and Plot command is the same graph.

  • This topic has 3 replies, 2 voices, and was last updated 1 year ago by dgteam.
Viewing 4 posts - 1 through 4 (of 4 total)
  • Author
    Posts
  • #15844
    rocus klont
    Participant

      Is it possible to use a pivot command (bars) and a plot command (line) in the same graph using the same x-axis values?

      Regards,

      R. Klont

      #15845
      dgteam
      Moderator

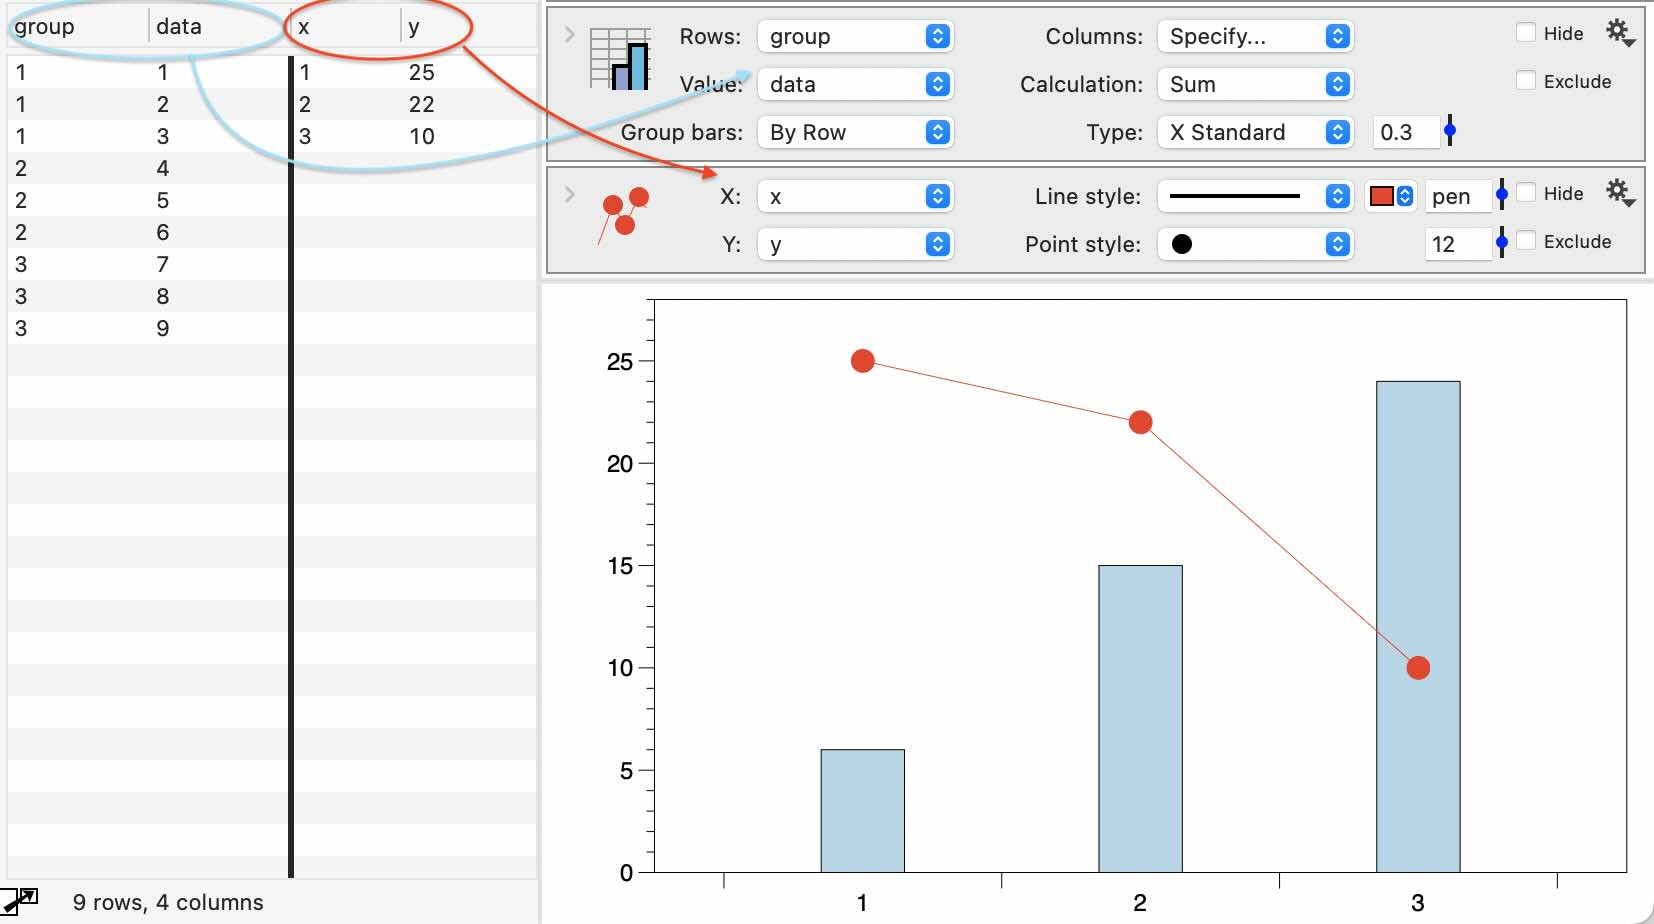
        Here you can have data grouped at the values 1,2,3 and then have a line plot where the x values are also 1,2,3.  Is that what you mean?

        Pivot and Line

        #15847
        rocus klont
        Participant

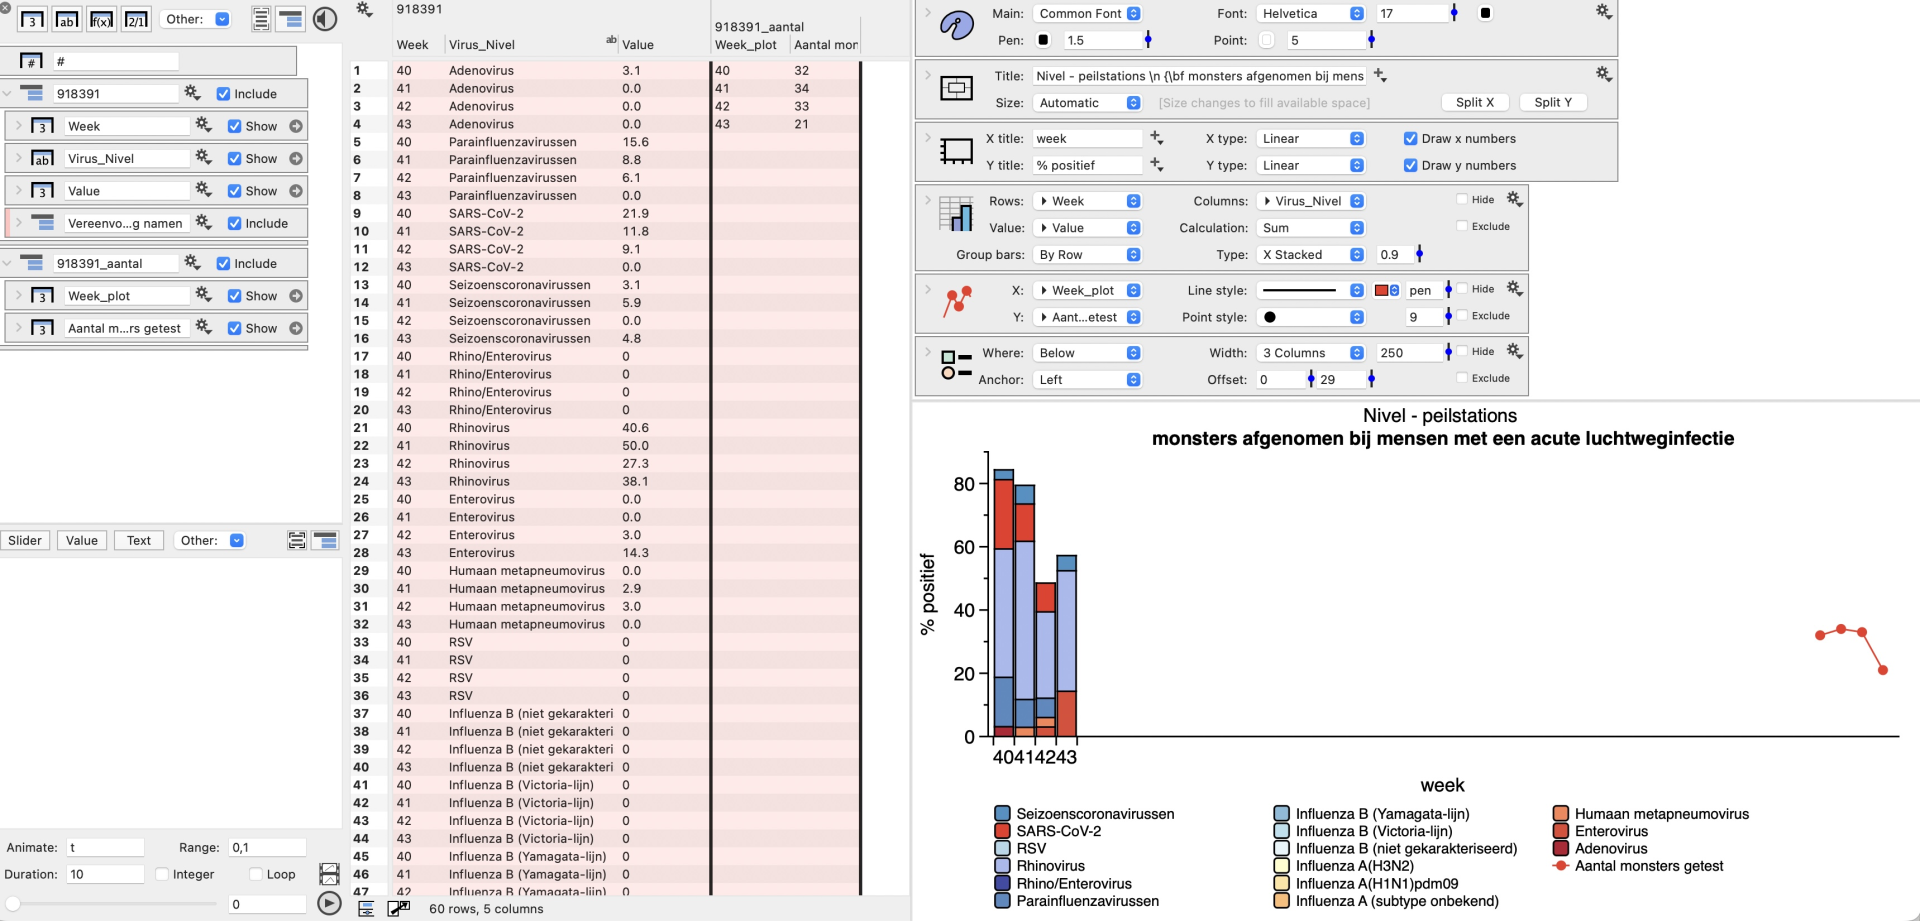
          Yes, but in my example this is not the case.

          What is wrong?Scherm­afbeelding 2025-11-06 om 15.21.02


          #15848
          dgteam
          Moderator

            Our example was at 1,2,3 so it just happens to match!

            The Pivot command uses a categorical x-axis by default where the labels start at 1.

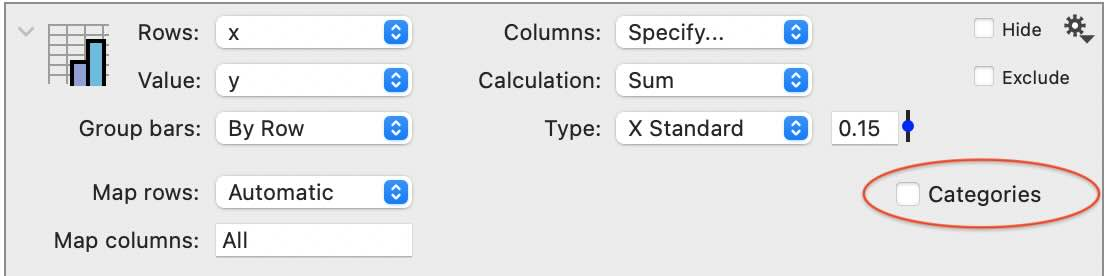
            Expand open the command and uncheck the Categories button.  Once you do that the values are plotted on a numerical axis and the locations should match.

            Categories

            Does that fix it?

          Viewing 4 posts - 1 through 4 (of 4 total)
          • You must be logged in to reply to this topic.

          DataGraph Forums › Technical Support › Support Desk › Pivot command and Plot command is the same graph.