spider chart
DataGraph Forums › Technical Support › Support Desk › spider chart
Tagged: spider chart
- This topic has 2 replies, 3 voices, and was last updated 1 year ago by
iantownsend.
-
AuthorPosts
-
August 10, 2025 at 6:29 pm #15785
petros mourouzis
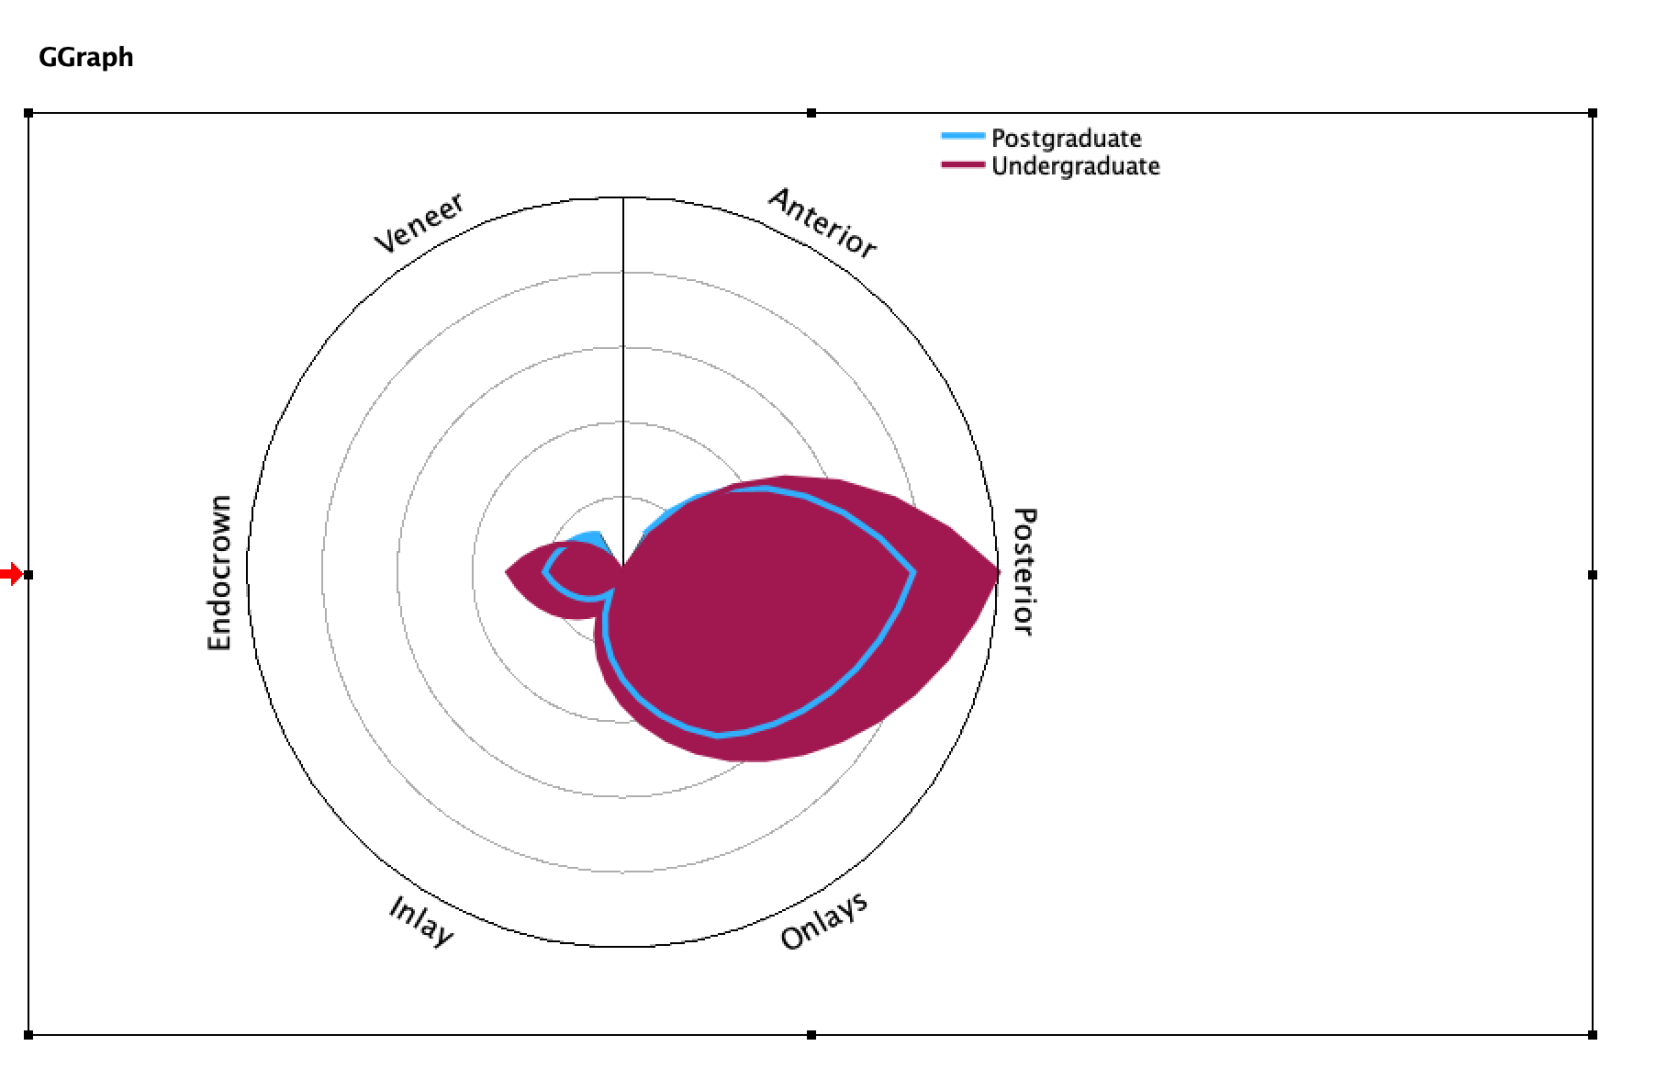
Participant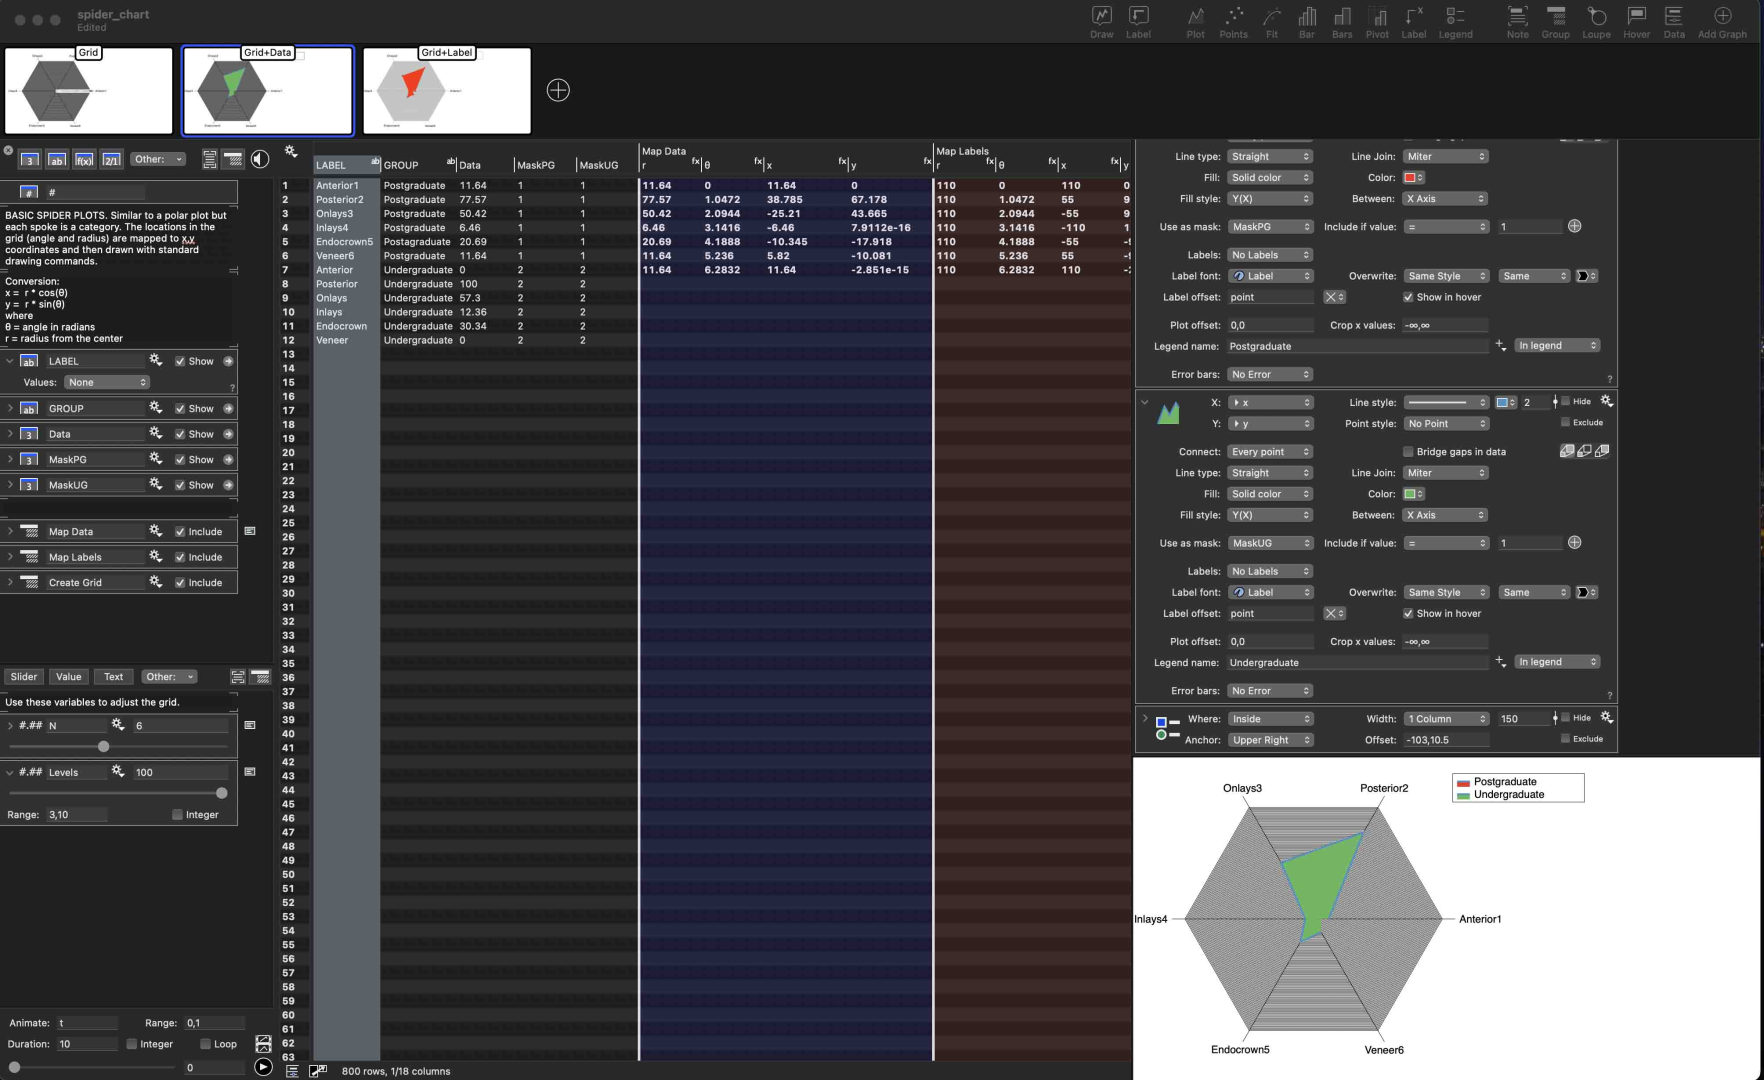 Hello, I have manage to create a spider chart in SPSS but I don’t like the look of it, so I thought to make it to Datagraph. However, I can not produce two polygons. I try the online example but it seems to complicated. I don’t know how to set up this. Is there any tutorial?
-
This topic was modified 1 year, 3 months ago by
petros mourouzis.
-
This topic was modified 1 year, 3 months ago by
August 11, 2025 at 7:13 pm #15788 dgteamModerator
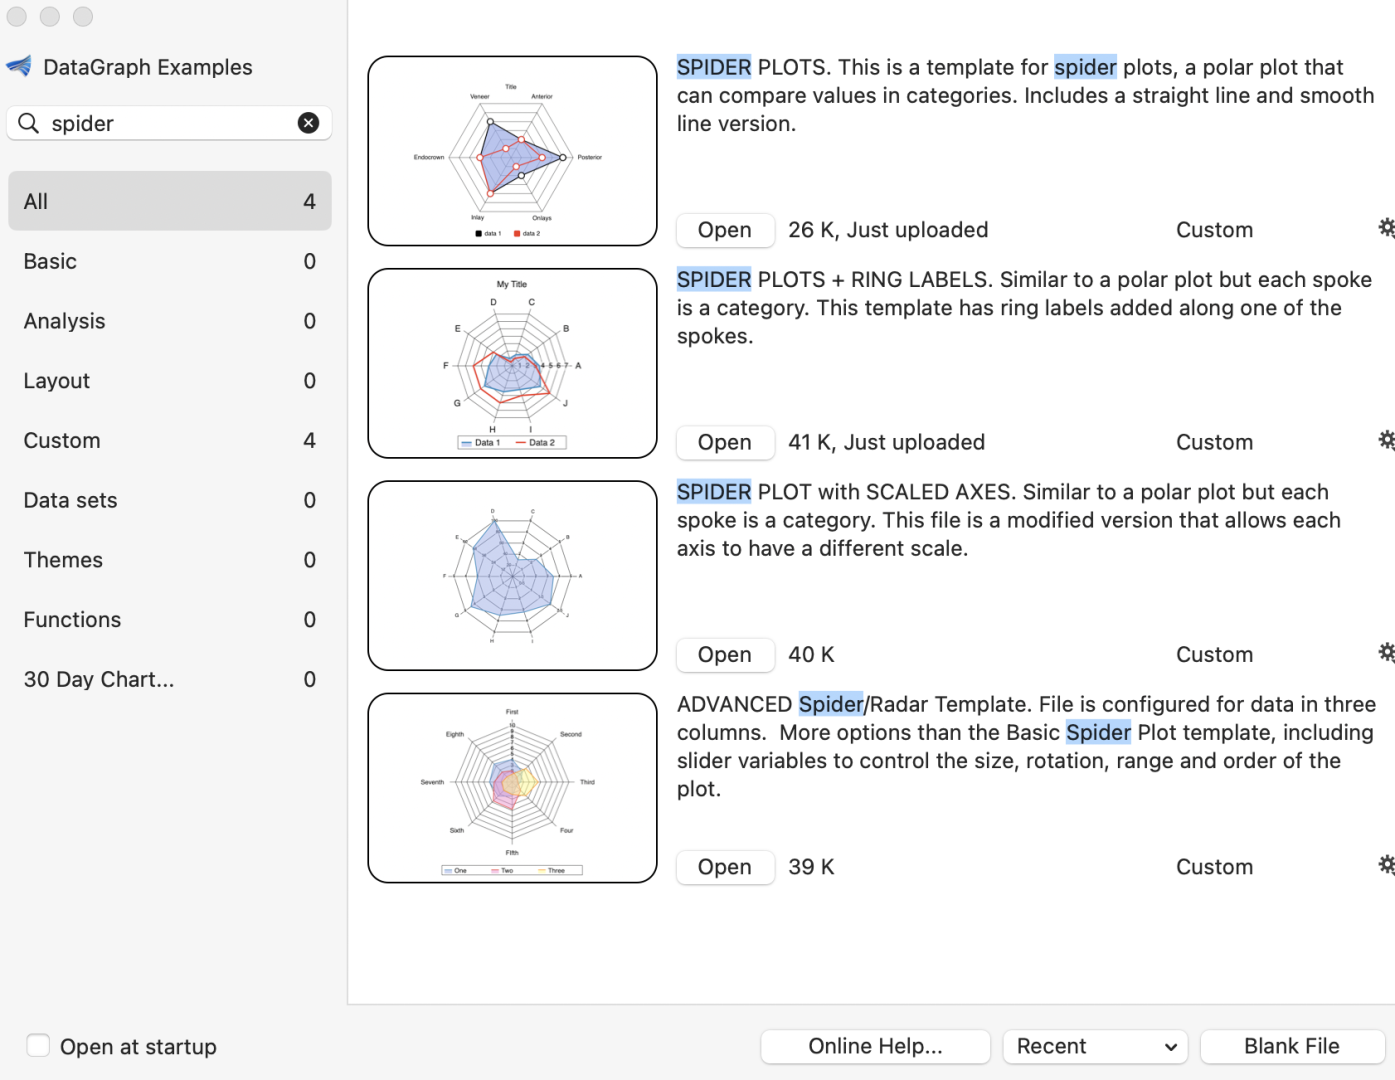
First, we looked at the templates and thought they needed a bit of updating. So we’ve added some additional instruction to the first two in particular. We also updated the sizing in these templates, since with our more recent edits to the spider plots were needing to be centered.
There are a couple of issues with the way you have your data set up currently.
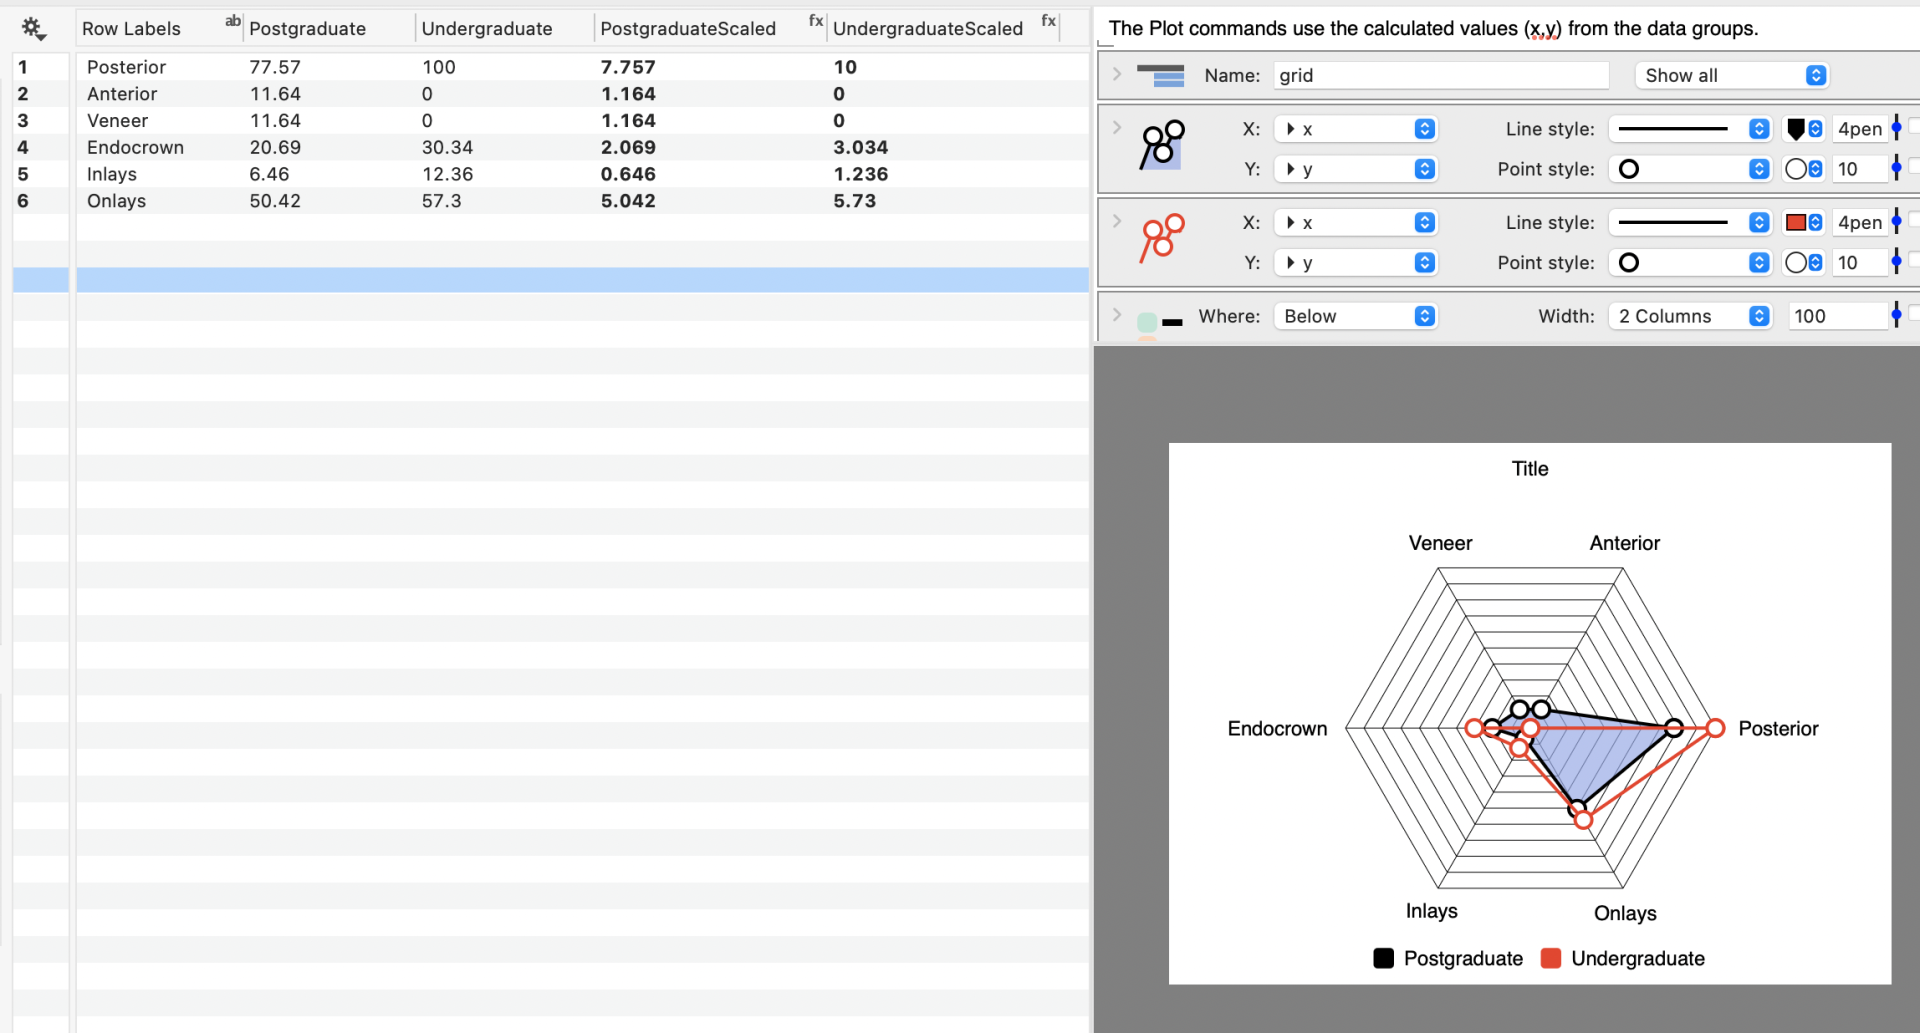
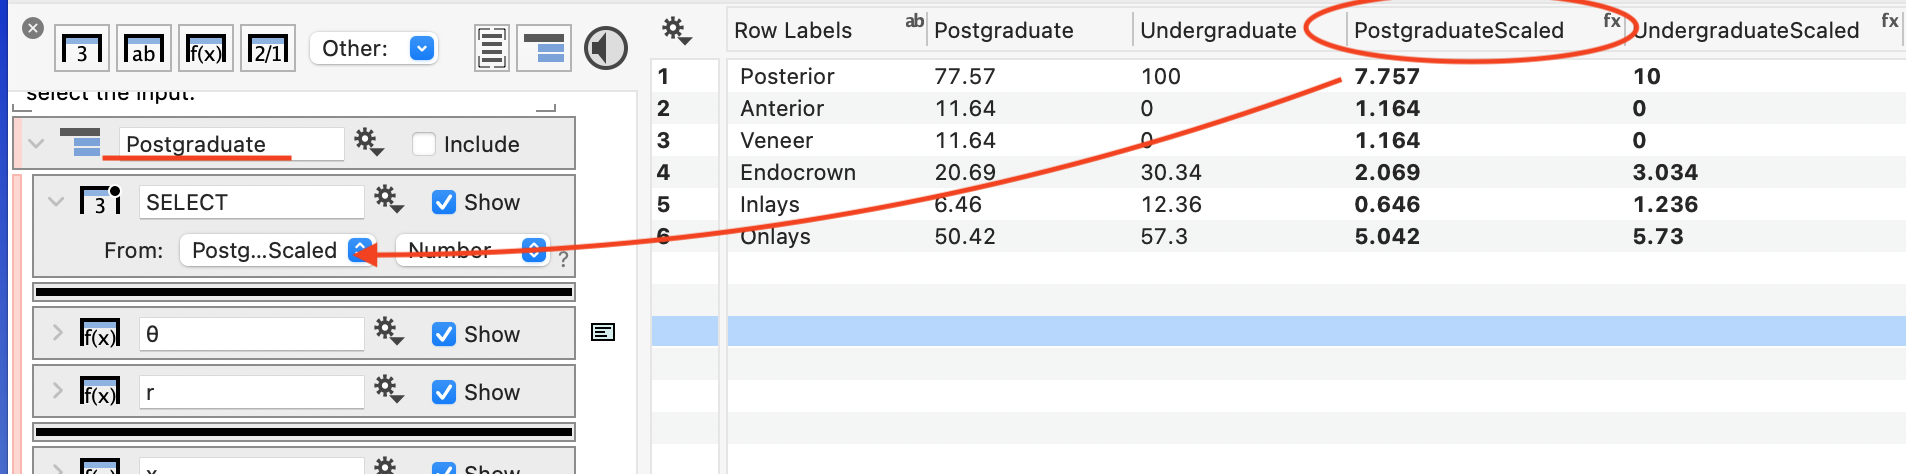
1 – The values are too high for the basic templates. The basic templates (first two) do not have any scaling when numbers get too high. So if you have numbers that go up to 100, the number of levels drawn will also be 100. The way around this is to scale down all of your numbers by a factor of 10.
For example, here is an example using the first template listed. Notice how we scaled each of the data columns down by 10 in an expression column.
 OK
These scaled columns are used as the input into the data processing groups, that are in the data side panel. Note that we also changed the name of the data processing group from “data 1” to “Postgraduate” .
2 – The other issue may already be something you noticed, which is that each set has to be in its own column. (For many commands you can use the data in a long format and use a mask, but these templates are not set up that way.)
What you might want to try is the Advanced Template…
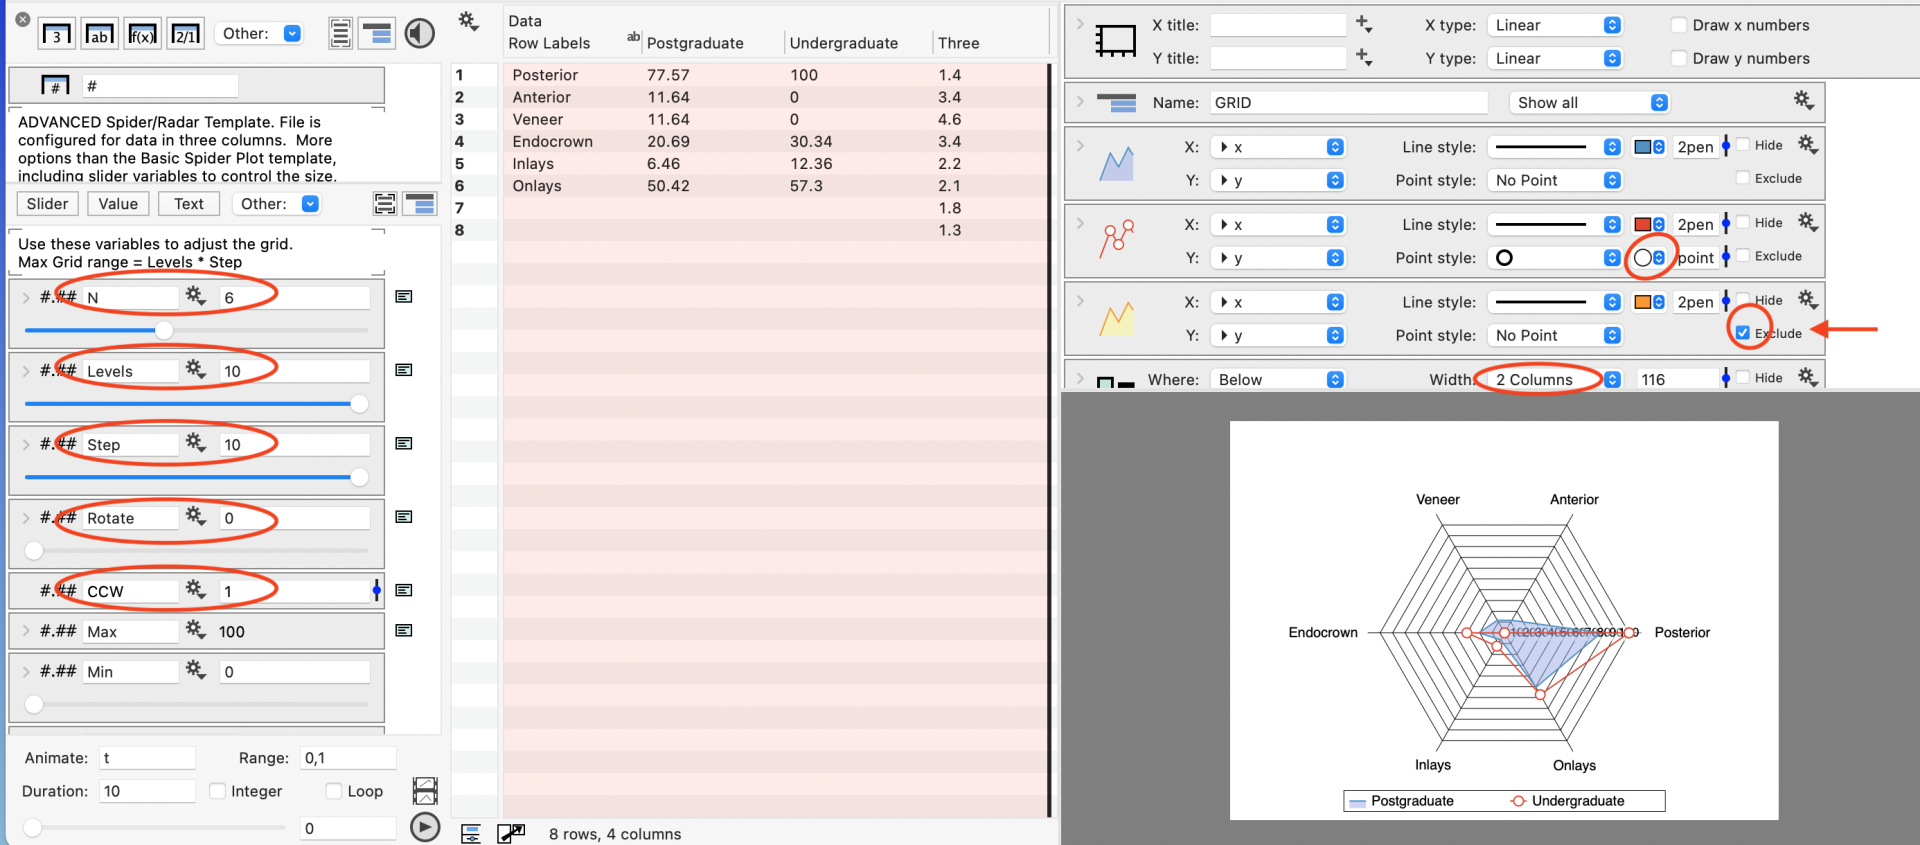
The advanced template already has a set of sliders, including the ability to scale the data automatically. To create the following image, I opened up the advanced template and selected the three columns and pasted your data over the existing columns.
The edit to the settings for the variables have been highlighted. By setting the levels to 10 and the step to 10, the maximum scale of the spider plot is 100.
The data for the third data set is also excluded and the legend is set to a two column format.
In summary, you can use one of the more basic templates, but you’ll need to scale your data down by 10. And in all of the templates, you’ll want to have your data separated into individual columns, that you can paste over the existing dataset in these temp.
Does this help?
November 9, 2025 at 4:49 am #15849iantownsend
ParticipantSorry for my slow response and THANK YOU.
I am still working through both spider and Sankey plots, but with your extra information they are starting to make sense to me. I am familiar with the use of both, but have never created them with Datagraph.
I appreciate your support.
-
This topic was modified 1 year, 3 months ago by
-
AuthorPosts
- You must be logged in to reply to this topic.
DataGraph Forums › Technical Support › Support Desk › spider chart