DataGraph 4.6 was released on October 14, 2020. Here are some new key features.
Graph Groups
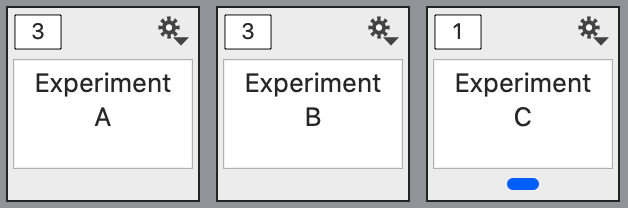
A new ‘Graph Group‘ mechanism has been added for grouping multiple graphs into a single object. Use to organize graphs and collapse them for easier navigating when you have a lot of graphs in a file.
Present from Zoom
The Presentation window is separate graph viewer that can be shared on video conferences, such as through Zoom.
Key Features:
- Create a separate presentation window.
- Easily switch between graphs from different files.
- Simultaneously edit/browse graphs while presenting.
Connect to R scripts
The R-DataGraph package allows you to combine the R statistical programming language with the power of DataGraph to bring a new level of flexibility and easy data visualization to your analyses. Use DataGraph as part of your workflow in the R statistical computing program (https://www.r-project.org). The DataGraph R package allows you to directly integrate output from the R language with DataGraph.
Composing Graphs for Publication
DataGraph 4.6 has new features for thumbnails to make it easier to combine/compose multiple separate graphs into one composite image. First create a blank, new graph composition (File > New Graph > For composition). Then drag and drop of graph thumbnails onto the command list. This creates a new Graphic command, set up for that image. To learn more see How to Combine Graphs.
Colors and Color Schemes
The Color scheme variable was updated with an option to change the transparency for all colors in the scheme.
Watch the following webinar to learn more about customizing colors and the color scheme variable, along with a demo of the new transparency option.
Release Notes
To learn more, see the full release notes.